
Figures & data
Figure 1. siTTR silences Wild-type (WT) and mutant TTR variants with similar potency. In vitro analysis of siRNAs targeting TTR using a Dual-Luciferase (Dual-Luc) reporter assay. For each variant, the corresponding nucleic acid change is listed in parentheses in the symbol legend. Data are expressed as normalized mRNA expression; error bars represent SEM (n = 2). Data fitted to a 4-parameter logistic non-linear regression; fitted EC50 values are 36, 28, 23, 30, 16 and 33 pM for WT, Val30Met (p.Val50Met), Thr60Ala (p.Thr80Ala), Ser77Tyr (p.Ser97Tyr), Ser77Phe (p.Ser97Phe) and Val122Ile (p.Val142Ile) variants, respectively.
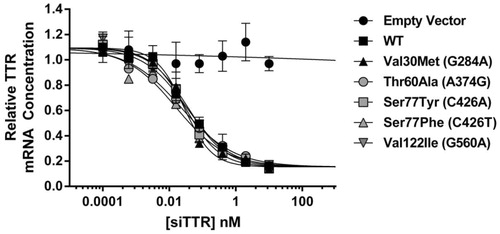
Figure 2. RNAi-mediated knockdown of hepatic TTR gene expression. Liver TTR mRNA and serum TTR protein following single dose administration of siTTR1 or siCTRL1 (A) or siTTR2 or PBS (B) in hTTR V30M HSF1± mice. Bar height represents group mean concentration; error bar represents the SEM; individual data point for each animal displayed as symbols within the bar. Treatment effect evaluated using 2-way ANOVA with Bonferroni’s multiple comparison test (**p < 0.01, ***p < 0.001, ****p < 0.0001). In panel (A), n = 3 for siCTRL1, n = 5 for all other groups. In panel (B), n = 4 for all groups.
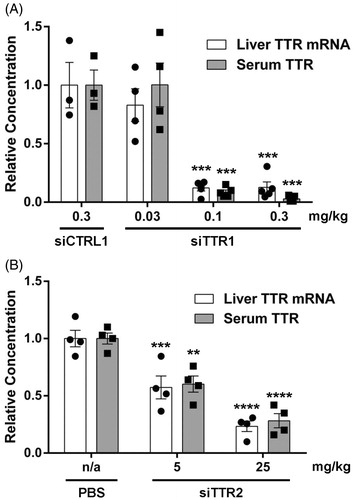
Figure 3. RNAi-mediated TTR knockdown prevents TTR deposition in hTTR V30M HSF1± mice. TTR tissue deposition in 15-month-old hTTR V30M HSF1± mice following repeat administration of siTTR1 or siCTRL1. (A) Relative serum TTR protein knockdown. (B) Representative images of immunohistochemical (IHC) TTR protein detection in: E, esophagus; S, stomach; D, duodenum; C, colon; SN, sciatic nerve; DRG, dorsal root ganglion; RPE, retinal pigmentosa epithelium; CP, choroid plexus; P, pancreatic alpha cells. (C) Relative TTR tissue deposition in select tissues. Tissue abbreviations as described earlier. In panel (A), symbols represent group mean relative concentration; error bars represent the SEM; arrows indicate administration of siTTR1 or siCTRL1. In panel (C), bar height represents group mean; error bar represents the SEM; individual data point for each animal displayed as symbols within the bar. The treatment effect in (A) and (C) was determined using 2-way ANOVA with Bonferroni’s multiple comparison test relative to respective control (*p < 0.05, **p < 0.01, ****p < 0.0001). siCTRL, n = 4; siTTR1, n = 8.
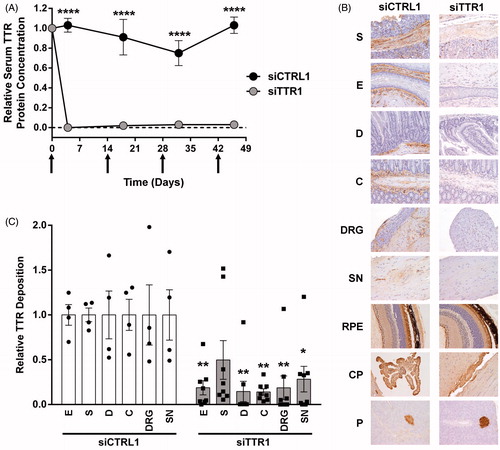
Figure 4. TTR tissue deposit regression correlates with RNAi-mediated knockdown of TTR. TTR tissue deposition in 15-month-old hTTR V30M HSF1± mice following repeat administration of PBS or siTTR2. (A) Mean relative serum TTR protein concentration (left y-axis) and total serum TTR protein exposure (right y-axis) during the 12-week course of treatment with PBS or siTTR2 at 1, 2.5 or 25 mg/kg. Each symbol represents the time averaged mean serum TTR protein concentration for each respective mouse, relative to PBS treated animals. The bar represents the group mean relative serum TTR protein concentration at a given dose level; error bars represent SEM. The treatment effect determined using 1-way ANOVA with Bonferroni’s multiple comparison test. (B) Relative TTR tissue deposition in: E, esophagus; S, stomach; D, duodenum; C, colon; SN, sciatic nerve; DRG, dorsal root ganglion. Bar height represents group mean relative deposition; error bar represents the SEM; individual data point for each animal displayed as symbols within the bar. The treatment effect determined using 2-way ANOVA with Bonferroni’s multiple comparison test. Group size: PBS, n = 3; 1 mg/kg, n = 7; 2.5 mg/kg, n = 5, 25 mg/kg, n = 4. Statistical analyzes: *p < 0.05, **p < 0.01, ***p < 0.001, ****p < 0.0001.
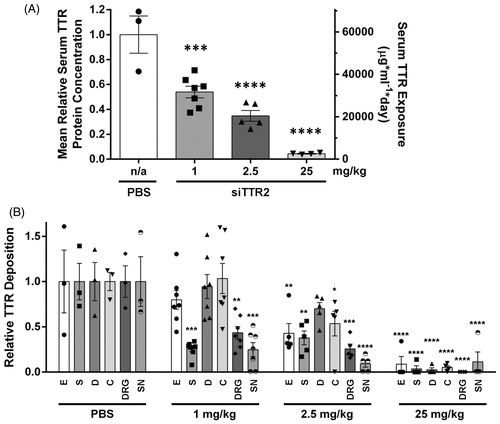
Figure 5. Effect of tetramer stabilization on TTR tissue deposition. TTR tissue deposition in 15-month-old hTTR V30M HSF1± mice following repeat administration of tafamidis or meglumine control. (A) Extent of serum TTR tetramer stabilization by tafamidis. Data represent mean % TTR tetramer stabilization at each time point (meglumine control, n = 4; tafamidis, n = 8); error bars represent SEM. Dashed horizontal line indicates 100% stabilization (2× initial tetramer concentration). Arrows indicate administration of tafamidis or meglumine control. See Supplementary Figure 2 for more detail. (B) Relative TTR tissue deposition in: E, esophagus; S, stomach; D, duodenum; C, colon; DRG, dorsal root ganglion; SN, sciatic nerve. Treatment effect in (A) and (B) evaluated using 2-way ANOVA with Bonferroni’s multiple comparison test (***p < 0.001, ****p < 0.0001).
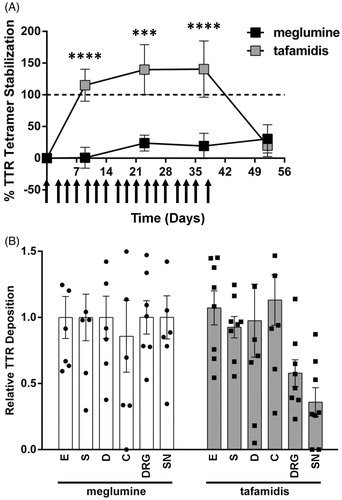
Figure 6. RNAi-mediated knockdown of TTR following repeat administration of patisiran and revusiran in the cynomolgus monkey. (A) Patisiran was administered to cynomolgus monkeys (n = 4 per group, 2 males, 2 females) at 0.3 mg/kg once every 4 weeks for seven total doses (Group 1) or once every 4 weeks (four doses) followed by once every 3 weeks (four doses) for a total of eight doses (Group 2). Note: An incomplete data set from Group 1 was previously published [Citation36] (B) Revusiran was administered to cynomolgus monkeys using 5 daily doses in week 1 (D0, D1, D2, D3 and D4) followed by weekly dosing for 4 weeks (D7, D14, D21 and D28) at dose levels of 2.5, 5 or 10 mg/kg. N = 3 per group. For both experiments, mean relative serum TTR protein concentration was measured and calculated as described earlier; error bars represent SEM. Arrows indicate time of dosing.
![Figure 6. RNAi-mediated knockdown of TTR following repeat administration of patisiran and revusiran in the cynomolgus monkey. (A) Patisiran was administered to cynomolgus monkeys (n = 4 per group, 2 males, 2 females) at 0.3 mg/kg once every 4 weeks for seven total doses (Group 1) or once every 4 weeks (four doses) followed by once every 3 weeks (four doses) for a total of eight doses (Group 2). Note: An incomplete data set from Group 1 was previously published [Citation36] (B) Revusiran was administered to cynomolgus monkeys using 5 daily doses in week 1 (D0, D1, D2, D3 and D4) followed by weekly dosing for 4 weeks (D7, D14, D21 and D28) at dose levels of 2.5, 5 or 10 mg/kg. N = 3 per group. For both experiments, mean relative serum TTR protein concentration was measured and calculated as described earlier; error bars represent SEM. Arrows indicate time of dosing.](/cms/asset/919b13df-b255-49ae-a346-d6e012dfb8bc/iamy_a_1160882_f0006_b.jpg)