801
Views
4
CrossRef citations to date
0
Altmetric
Research Article

Identification and characterization of lipopolysaccharide binding protein (LBP) as an estrogen receptor α specific serum biomarker

, , , , &
Pages 172-179 | Received 19 Aug 2011, Accepted 01 Jan 2012, Published online: 03 Feb 2012

Figures & data

Figure 1.  Four and fourteen day E2 dosing regimens lead to uterine weight increases in c57BL and BERKO but not AERKO mice. Uterine weight of c57BL and BERKO mice treated for (A) four days exhibited significant weight increases of 3.2 and 3.4 fold respectively. (B) Fourteen day treatment resulted in c57BL E2 treated mice resulted in a 7.3-fold significant increase while BERKO E2 treated mice had a 9.5-fold significant increase. (C) c57BL E2 treated mice for 14 days resulted in an 8.7-fold significant increase while AERKO E2 exhibited similar weights to AERKO vehicle treated mice. Error bars indicate standard error, *p < 0.001. Lines indicate pairwise comparisons.
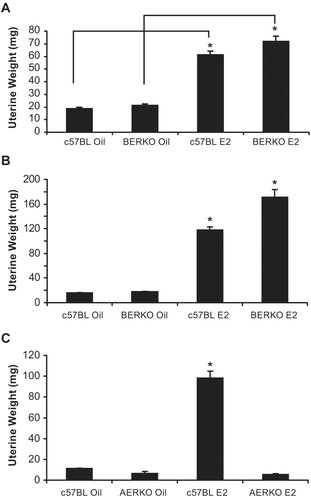
Figure 1.  Four and fourteen day E2 dosing regimens lead to uterine weight increases in c57BL and BERKO but not AERKO mice. Uterine weight of c57BL and BERKO mice treated for (A) four days exhibited significant weight increases of 3.2 and 3.4 fold respectively. (B) Fourteen day treatment resulted in c57BL E2 treated mice resulted in a 7.3-fold significant increase while BERKO E2 treated mice had a 9.5-fold significant increase. (C) c57BL E2 treated mice for 14 days resulted in an 8.7-fold significant increase while AERKO E2 exhibited similar weights to AERKO vehicle treated mice. Error bars indicate standard error, *p < 0.001. Lines indicate pairwise comparisons.

Figure 2.  Global gene expression microarray analysis in liver of C57BL, AERKO and BERKO mice after 14 day E2 treatment identify potential ERα target genes. (A) Heat Map of changes in mRNA levels in liver of C57BL, AERKO and BERKO by microarray analysis after 14 day E2 treatment. ANOVA analysis was performed to identify unique patterns of gene regulation based on ER status followed by agglomerative clustering analysis (Matlab). Each row represents the different mouse models possessing different ER status and gene regulation. Up-regulated genes (pink), down-regulated genes (aqua), and genes showing no change verses control (black). (B) Fold change of LBP in mouse liver mRNA from c57BL and BERKO mice treated with E2 showed significant increases in LBP mRNA expression (1.5 and 1.7-fold respectively) while AERKO E2 did not change. (C) Change in serum LBP protein measured by ELISA (see materials and methods) when c57BL mice were treated with E2 for 14 days, a significant (p < 0.001) increase of 6.5-fold in serum LBP was demonstrated compared to the vehicle group. Error bars indicate standard error, *p < 0.001.

Figure 2.  Global gene expression microarray analysis in liver of C57BL, AERKO and BERKO mice after 14 day E2 treatment identify potential ERα target genes. (A) Heat Map of changes in mRNA levels in liver of C57BL, AERKO and BERKO by microarray analysis after 14 day E2 treatment. ANOVA analysis was performed to identify unique patterns of gene regulation based on ER status followed by agglomerative clustering analysis (Matlab). Each row represents the different mouse models possessing different ER status and gene regulation. Up-regulated genes (pink), down-regulated genes (aqua), and genes showing no change verses control (black). (B) Fold change of LBP in mouse liver mRNA from c57BL and BERKO mice treated with E2 showed significant increases in LBP mRNA expression (1.5 and 1.7-fold respectively) while AERKO E2 did not change. (C) Change in serum LBP protein measured by ELISA (see materials and methods) when c57BL mice were treated with E2 for 14 days, a significant (p < 0.001) increase of 6.5-fold in serum LBP was demonstrated compared to the vehicle group. Error bars indicate standard error, *p < 0.001.

Figure 3.  Dose-dependent increase in serum LBP with an ERα agonist: propyl-pyrazole-triol (PPT). c57BL mice treated with 0.1 mg/kg PPT did not result in a significant difference in LBP serum levels (when compared to vehicle, measured by ELISA), 1.0 mg/kg PPT led to a 1.9-fold and 10 mg/kg PPT demonstrated a 2.6-fold significant increase in serum LBP. A significant 1.9-fold increase of serum LBP was also demonstrated when the mice were treated with 0.2 mg/kg E2. Error bars indicate standard error of the mean. *, p = 0.002; **, p = 0.003; and ***, p < 0.001.
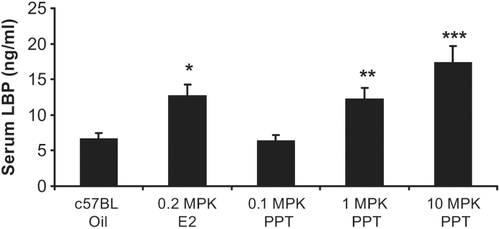
Figure 3.  Dose-dependent increase in serum LBP with an ERα agonist: propyl-pyrazole-triol (PPT). c57BL mice treated with 0.1 mg/kg PPT did not result in a significant difference in LBP serum levels (when compared to vehicle, measured by ELISA), 1.0 mg/kg PPT led to a 1.9-fold and 10 mg/kg PPT demonstrated a 2.6-fold significant increase in serum LBP. A significant 1.9-fold increase of serum LBP was also demonstrated when the mice were treated with 0.2 mg/kg E2. Error bars indicate standard error of the mean. *, p = 0.002; **, p = 0.003; and ***, p < 0.001.

Figure 4.  Four day 17β-estradiol and PPT treatments have no effect on serum LBP in AERKO mice while E2 lowers LBP mRNA in AERKO mice livers. (A) AERKO mice treated with E2 or PPT for 4 days result in no difference in serum LBP levels when compared to vehicle (measured by ELISA). B) E2 treatment resulted in a 40% significant decrease of LBP mRNA (measured by real-time RT-PCR, see materials and methods) in AERKO mice liver while the ERα subtype specific agonist, PPT did not demonstrate a significant effect (compared to vehicle). Error bars indicate standard error of the mean. *, p = 0.01.

Figure 4.  Four day 17β-estradiol and PPT treatments have no effect on serum LBP in AERKO mice while E2 lowers LBP mRNA in AERKO mice livers. (A) AERKO mice treated with E2 or PPT for 4 days result in no difference in serum LBP levels when compared to vehicle (measured by ELISA). B) E2 treatment resulted in a 40% significant decrease of LBP mRNA (measured by real-time RT-PCR, see materials and methods) in AERKO mice liver while the ERα subtype specific agonist, PPT did not demonstrate a significant effect (compared to vehicle). Error bars indicate standard error of the mean. *, p = 0.01.

Figure 5.  BERKO mice treated with PPT for 4 days increase serum LBP, liver mRNA LBP expression, and uterine weight. (A) c57BL and BERKO mice treated with vehicle, E2, and PPT for 4 days. c57BL mice treated with E2 led to a significant increase of 2.6-fold in serum LBP (measured by ELISA) when compared to the vehicle (oil) group. c57BL mice treated with PPT demonstrated a significant increase of 3.6-fold in serum LBP compared to the vehicle (oil) group. BERKO mice treated with E2 (10.6 ng/mL) resulted in a slight increase of serum LBP when compared to the BERKO’s treated with the oil vehicle (9.2 ng/mL). BERKO mice treated with PPT showed a significant 2.6-fold increase in comparison to the BERKO vehicle (oil). (B) Mouse liver mRNA LBP expression was measured (real-time RT-PCR), a 1.2-fold increase was exhibited in c57BL mice treated with E2 when compared to the c57BL vehicle (oil) while a significant 1.5-fold increase was seen in c57BL mice treated with PPT when compared to the c57BL vehicle (oil) mice. BERKO mice treated with sesame oil demonstrated a significant 1.5-fold increase of LBP mRNA expression when compared to the c57BL mice treated with vehicle (oil). BERKO mice treated with E2 led to a 12% increase in LBP mRNA expression when compared to BERKO mice treated with vehicle (oil). BERKO mice treated with E2 compared to the c57BL mice treated with vehicle (oil) yielded a 1.7-fold significant increase. BERKO mice treated with PPT and BERKO mice treated with vehicle (oil) express approximately the same amount of LBP mRNA. BERKO mice treated with PPT express a 1.5-fold significant increase compared to the c57BL treated vehicle (oil) mice. (C) c57BL mice treated with E2 resulted in a 3.8-fold significant increase in uterine weight while PPT treatment resulted in a 2.8-fold significant increase (compared to c57BL mice treated with sesame oil vehicle). BERKO mice treated with E2 or PPT demonstrated 3.5 and 2.5-fold significant increases respectively (compared to BERKO mice treated with oil vehicle). AERKO mice treated with vehicle (oil), E2, or PPT led to no differences in uterine weight. Error bars indicate standard error of the mean. *, p = 0.004; **, p < 0.001; and ***, p < 0.05. Lines indicate pairwise comparisons.
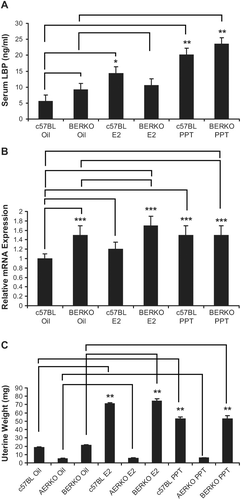
Figure 5.  BERKO mice treated with PPT for 4 days increase serum LBP, liver mRNA LBP expression, and uterine weight. (A) c57BL and BERKO mice treated with vehicle, E2, and PPT for 4 days. c57BL mice treated with E2 led to a significant increase of 2.6-fold in serum LBP (measured by ELISA) when compared to the vehicle (oil) group. c57BL mice treated with PPT demonstrated a significant increase of 3.6-fold in serum LBP compared to the vehicle (oil) group. BERKO mice treated with E2 (10.6 ng/mL) resulted in a slight increase of serum LBP when compared to the BERKO’s treated with the oil vehicle (9.2 ng/mL). BERKO mice treated with PPT showed a significant 2.6-fold increase in comparison to the BERKO vehicle (oil). (B) Mouse liver mRNA LBP expression was measured (real-time RT-PCR), a 1.2-fold increase was exhibited in c57BL mice treated with E2 when compared to the c57BL vehicle (oil) while a significant 1.5-fold increase was seen in c57BL mice treated with PPT when compared to the c57BL vehicle (oil) mice. BERKO mice treated with sesame oil demonstrated a significant 1.5-fold increase of LBP mRNA expression when compared to the c57BL mice treated with vehicle (oil). BERKO mice treated with E2 led to a 12% increase in LBP mRNA expression when compared to BERKO mice treated with vehicle (oil). BERKO mice treated with E2 compared to the c57BL mice treated with vehicle (oil) yielded a 1.7-fold significant increase. BERKO mice treated with PPT and BERKO mice treated with vehicle (oil) express approximately the same amount of LBP mRNA. BERKO mice treated with PPT express a 1.5-fold significant increase compared to the c57BL treated vehicle (oil) mice. (C) c57BL mice treated with E2 resulted in a 3.8-fold significant increase in uterine weight while PPT treatment resulted in a 2.8-fold significant increase (compared to c57BL mice treated with sesame oil vehicle). BERKO mice treated with E2 or PPT demonstrated 3.5 and 2.5-fold significant increases respectively (compared to BERKO mice treated with oil vehicle). AERKO mice treated with vehicle (oil), E2, or PPT led to no differences in uterine weight. Error bars indicate standard error of the mean. *, p = 0.004; **, p < 0.001; and ***, p < 0.05. Lines indicate pairwise comparisons.

Figure 6.  17β-estradiol increases LBP mRNA in rat liver. Sprague–Dawley CD rats were treated vehicle (oil), 0.012, 0.05, and 0.2 mg/kg E2 for 3 days. mRNA LBP expression measured (by real-time RT-PCR) in the liver yielded a dose dependent significant increase of 1.3, 1.4, and 1.5-fold (compared to oil vehicle) when dosed with, 0.012, 0.05, and 0.2 mg/kg E2 respectively. Error bars indicate standard error of the mean. *, p < 0.05.

Figure 6.  17β-estradiol increases LBP mRNA in rat liver. Sprague–Dawley CD rats were treated vehicle (oil), 0.012, 0.05, and 0.2 mg/kg E2 for 3 days. mRNA LBP expression measured (by real-time RT-PCR) in the liver yielded a dose dependent significant increase of 1.3, 1.4, and 1.5-fold (compared to oil vehicle) when dosed with, 0.012, 0.05, and 0.2 mg/kg E2 respectively. Error bars indicate standard error of the mean. *, p < 0.05.
Supplemental material

Supplementary Material

Download PDF (53.8 KB)