Figures & data
Table 1. Association between IL-8-251 genotype and clinicopathologic factors.
Figure 1. Overall survival curves according to genotype of the IL-8-251 polymorphism in gastric carcinoma patients. Significant differences were observed between the A/A genotype and A/T & T/T genotype groups.
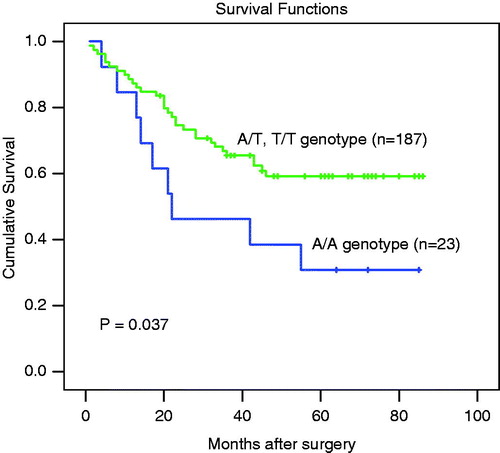
Table 2. Multivariate analysis of the prognostic impact of the IL-8-251 T > A polymorphism by the Cox proportional hazard model with a backward stepwise procedure.
Supplemental material