Figures & data
Figure 1. Result of shotgun proteomics based on iTRAQ method. (A) Experimental scheme. (B) Venn diagram showing the ratio of proteins that were included in OA and control cartilages based on the results of iTRAQ method. The diagram defines increased proteins for which OA/control ratio was more than 1.25 and decreased proteins for which the OA/control ratio was less than 0.75.
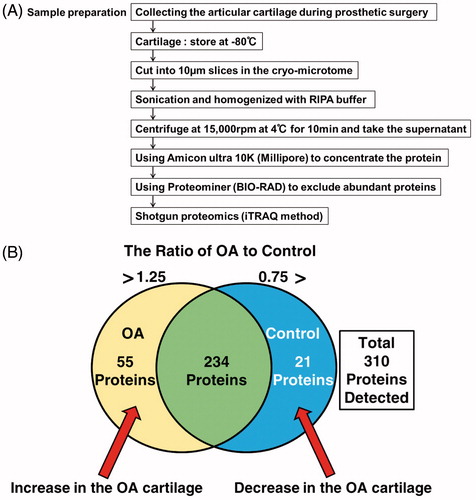
Table 1. The articular cartilage proteome.
Table 2. Characteristics of the OA patients and controls in this study.
Figure 2. Western blot analysis of LECT2, BAALC and PRDX6. (A) We confirmed the protein expression levels of LECT2, BAALC and PRDX6 in OA and control. Protein gel was stained with SYPRO ruby. (B) Statistical analysis of western blot. Quantities are indicated relative to the average value of each protein level in controls. *p < 0.05, statistically significant differences between OA and control, as determined by Student’s t-test. Error bars indicate SEM. LECT2 (control, n = 5; OA, n = 16; p = 0.005), BAALC (control, n = 5; OA, n = 16; p = 0.051), PRDX6 (control, n = 5; OA, n = 16; p = 0.011). (#) p = 0.051.
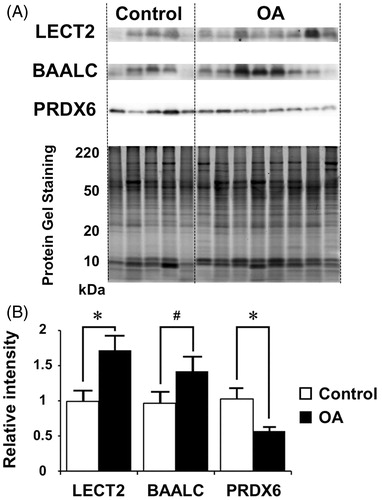
Figure 3. Experimental correlation between LECT2 protein levels and Age in OA patients. (A) Age (>65, n = 11; <65, n = 5; LECT2, p = 0.012; BAALC, p = 0.397; PRDX6, p = 0.166). (B) K-L Grade (>IV, n = 8; <III, n = 8; LECT2, p = 0.401; BAALC, p = 0.282; PRDX6, p = 0.131). (C) Height (>160 cm, n = 4, <160 cm, n = 12; LECT2, p = 0.057; BAALC, p = 0.107; PRDX6, p = 0.482). (D) BMI (>25, n = 4; <25, n = 12; LECT2, p = 0.298; BAALC, p = 0.301; PRDX6, p = 0.330). (E) Gender (male, n = 5; female, n = 11; LECT2, p = 0.420; BAALC, p = 0.284; PRDX6, p = 0.304). (F) Hip or Knee (hip, n = 5; knee, n = 11; LECT2, p = 0.338; BAALC, p = 0.217; PRDX6, p = 0.106). *p < 0.05, statistically significant differences between >65 and <65, as determined by Student’s t-test. Error bars indicate SEM. (#) p = 0.057. Quantities are indicated relative to the average value of each protein level in controls.
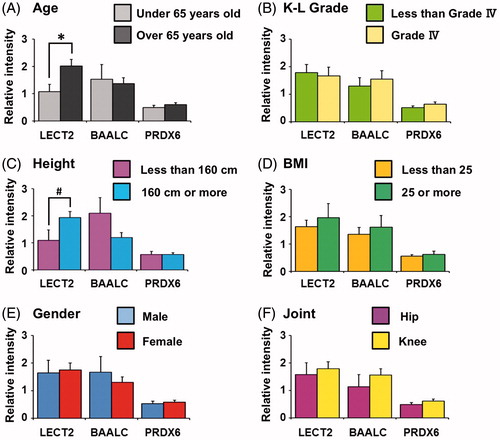
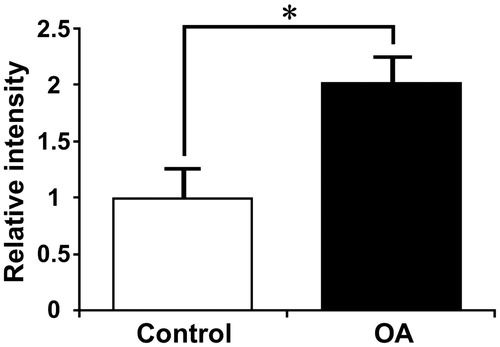
Figure 4. The level of LECT2 in control and OA patient at over 65 years of age. We recalculated expression level of LECT2 in OA and control cartilage by excluding the case of under 65 years of age. LECT2 was increased in OA with a significant difference compared with control (Control n = 3, OA n = 11). *p < 0.05, as determined by Student’s t-test. Error bars indicate SEM.