
Figures & data
Table 1. Biomarkers of biological effect.
Table 2. Biomarkers, smokers versus never smokers, intent-to-treat, week 0.
Figure 1. Percent change in sICAM1 over time in smokers switched to tobacco-heating cigarettes (TH), snus or ultra-low machine yield tobacco-burning cigarettes (TB). *Statistically significant reduction (p<0.05) from week 0.
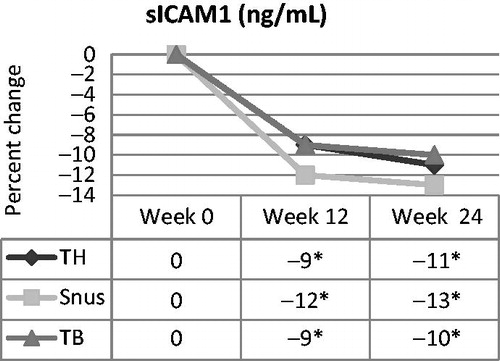
Figure 2. Percent change in WBC over time in smokers switched to tobacco-heating cigarettes (TH), snus or ultra-low machine yield tobacco-burning cigarettes (TB). *Statistically significant reduction (p<0.05) from week 0.
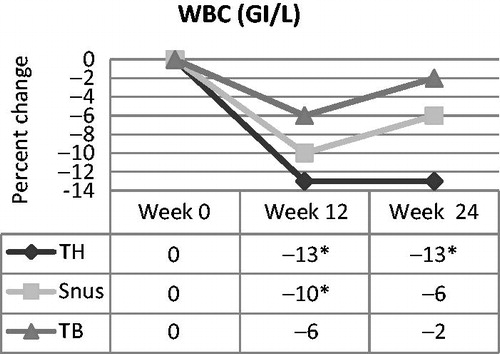
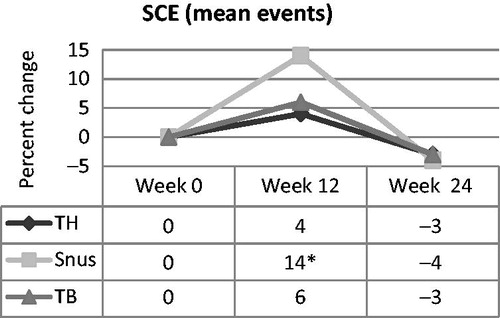
Figure 3. Percent change in SCE mean events over time in smokers switched to tobacco-heating cigarettes (TH), snus or ultra-low machine yield tobacco-burning cigarettes (TB). *Statistically significant difference (p<0.05) from week 0.
Supplemental material