Figures & data
Figure 1. Role of collagen network in articular cartilage. Artistic impression of Benninghoff’s “arcade model” of collagen fibre organization in human cartilage (Benninghoff, Citation1925), indicated as dashed white lines originating from the calcified zone (bottom), drawn over solarized micrograph. Hyaline cartilage appears greyish, with embedded chondrocytes (black), underlying subchondral bone white and bone marrow dark.
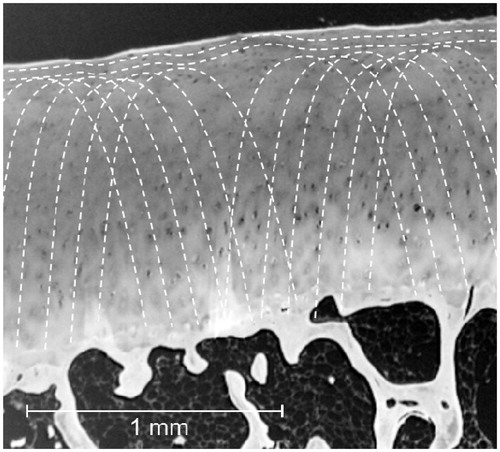
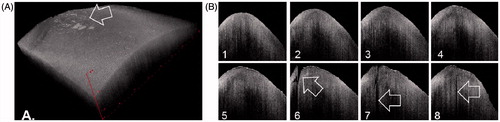
Figure 2. OCT-based articular surface evaluation. Topographical reconstruction of human articular cartilage ex vivo (A). The volumetric dataset to reconstruct this 8 × 8 mm macroscopically only slightly degraded, Outerbridge grade 1, specimen from the medial femoral condyle in 3D consists of 100 adjacent 2D OCT images. Note the essentially smooth articular surface around a focal lesion (arrow). Individual, in silico sliced 2D cross-sectional OCT images from this dataset representing 1 mm intervals (B, front-to-back). Smooth surfaces of early sections (B1 through B5) matching the first half of the in silico reconstructed tissue (A). Large, surfacing clefts (arrows; B6, B7) and a smaller sub-surface cleft (B8) corresponding to (peri-)lesional cartilage damage in A.