Figures & data
Figure 1. Schematic overview of the experimental design used in this study.
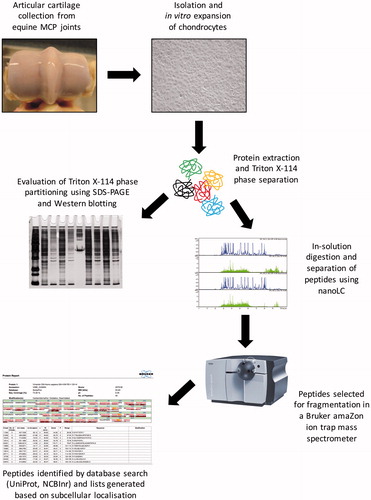
Figure 2. Validation of the efficacy of the Triton X-114 phase separation method. (A) Distribution of protein bands in the hydrophobic (1) and hydrophilic (2) fractions following phase partitioning in total lysates from primary equine articular chondrocyte cultures. After SDS–PAGE, protein bands were visualised using silver staining (M, molecular weight marker). Representative gel image. (B) Western blot experiment performed on both hydrophobic and hydrophilic fractions to probe for the presence and relative abundance of the membrane-bound Na+, K+-ATPase. Numbers below bands represent integrated densities determined by ImageJ freeware. Representative image. (C). The relative distribution of identified proteins following analysis by nanoLC-MS/MS based on their solubility in both hydrophobic and hydrophilic fractions. Numbers outside pie charts represent the actual numbers of proteins identified in each subgroup.
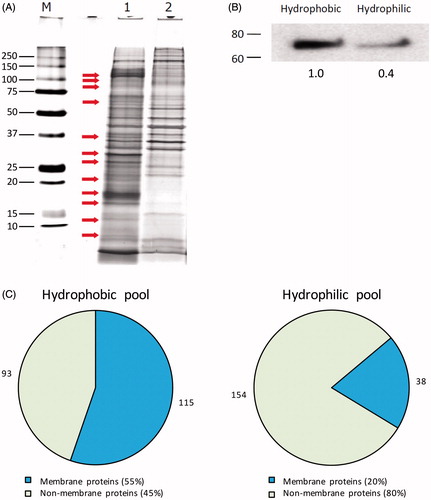
Figure 3. Subcellular distribution of the identified membrane proteins in the hydrophobic fraction. PM proteins were further classified according to their main function based on GO annotations. Numbers outside pie charts represent the actual numbers of proteins identified in each subgroup.
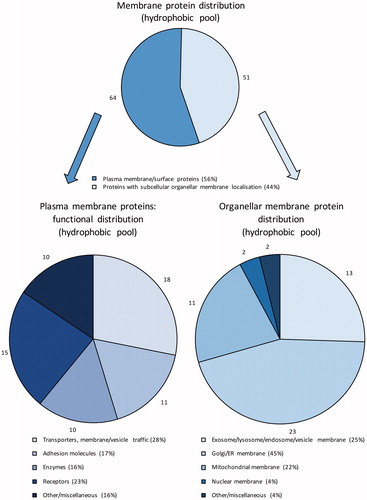
Table 1. Functional classification of PM proteins in the hydrophobic fraction identified in equine articular chondrocytes based on GO annotations.
Table 2. Subcellular distribution of membrane proteins in the hydrophobic pool identified in equine articular chondrocytes based on GO annotations.
Figure 4. Subcellular localisation of the identified non-membrane proteins in the hydrophobic fraction based on GO annotations. Numbers outside pie chart represent the actual numbers of proteins identified in each subgroup.
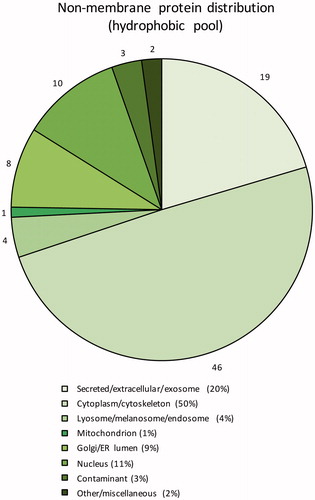
Table 3. Subcellular distribution of non-membrane proteins in the hydrophobic pool identified in equine articular chondrocytes based on GO annotations.
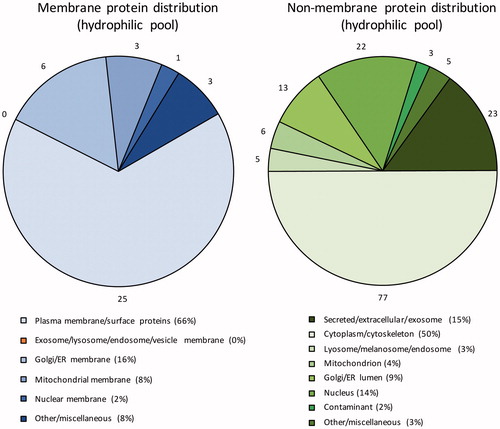
Figure 5. Subcellular localisation of the identified membrane and non-membrane proteins in the hydrophilic fraction based on GO annotations. Numbers outside pie charts represent the actual numbers of proteins identified in each subgroup.