Figures & data
Table 1. Questions and answers used in this study from the survey that was sent to participants on 5 August 2015. All questions were optional except Q6, which was mandatory to answer to complete the survey; 1233 women contributed to the survey and 1186 women answered the mandatory question.
Figure 1. Flow chart describing how pregnancies are detected in the study (4054 women).
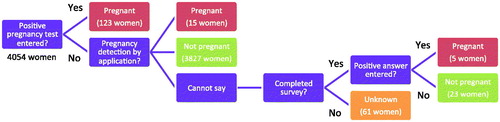
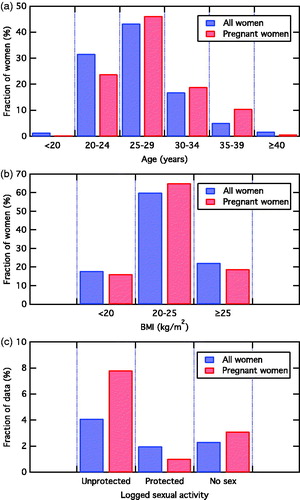
Table 2. Age and BMI distributions among all participants in the study not listed as unknown in Figure 1 (3993 women). The distribution of number of children for the subset of women who answered the questionnaire is also presented.
Table 3. Previous contraceptive method prior to the study, as well as chosen contraceptive method for red (fertile) days given by the application. The data were provided by 1233 women who answered the questionnaire. Women were able to select multiple choices or skip the question(s) completely.
Table 4. Pregnancy classification and contraceptive efficacy calculated according to the Pearl Index based on woman-years.
Figure 2. The probability of not becoming pregnant over time, measured in ordinal cycle number. The filled red area is based on experimental data from Table 5 and black solid lines are the corresponding 95% CIs. The black dashed line is the fitted probability of not becoming pregnant, from which the pregnancy rate is calculated. The inset shows the evolution of the non-pregnancy probability over several years predicted by the fitted pregnancy rate (black dashed line). Experimental data are here shown as a red line, whereas black solid lines correspond to the fitted pregnancy rates of the 95% CI.
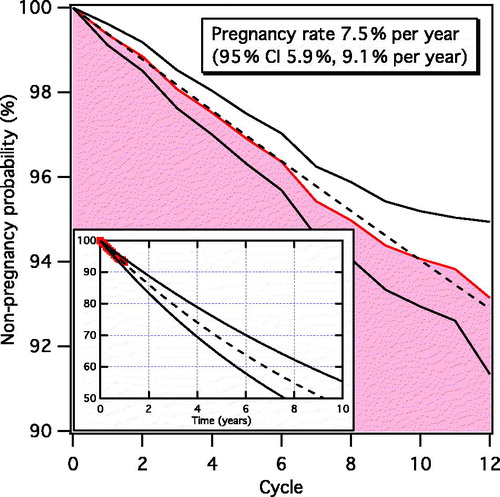
Table 5. Life-table analysis presenting the number of women exposed to the risk of becoming pregnant by cycle, the number of cumulative pregnancies, the cumulative pregnancy probability and its 95% CI. The cumulative pregnancy probability is calculated on a cycle basis, where cycle 1 corresponds to the first cycle for which the ovulation day was detected and cycle 12 implies that the women were exposed to at least 11 full cycles after cycle 1. 60 out of 3993 women dropped out prior to detection of their first ovulation day and are therefore censored before cycle 1.
Figure 3. Comparison of age (a) and BMI (b) distribution of all participants (blue) listed in Table 2 with that of only pregnant women (red). Both distributions are normalised to the total number of women who make up each distribution (3993 women and 143 pregnant women, respectively). (c) Comparison of logged sexual activity for all women (blue) and pregnant women (red), in terms of unprotected intercourse, protected intercourse and no intercourse, normalised to the total number of data entries for each sample group.