Figures & data
Table 1. Demographics of mothers, children with Down syndrome or Rett syndrome, and family characteristics.
Figure 1. Perceived parental availability of time, proportion of total possible scores, per domain, per condition.
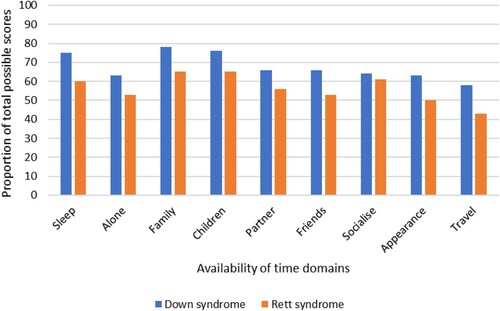
Figure 2. Perceived parental availability of time, frequency of “not at all adequate” responses, per domain, per condition.
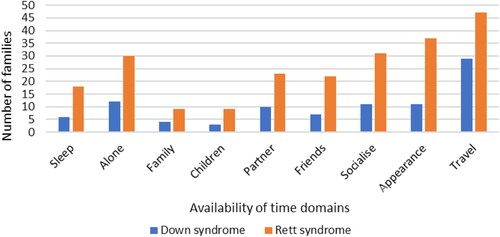
Figure 3. Parent perceived advantages for siblings of children with Down syndrome or Rett syndrome.
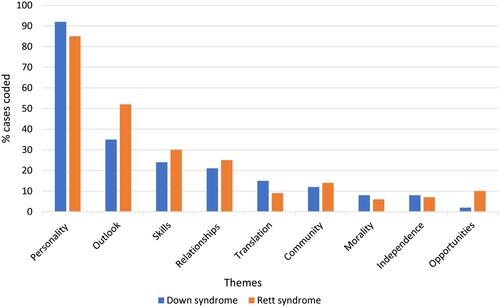
Figure 4. Parent perceived disadvantages for siblings of children with Down syndrome or Rett syndrome.
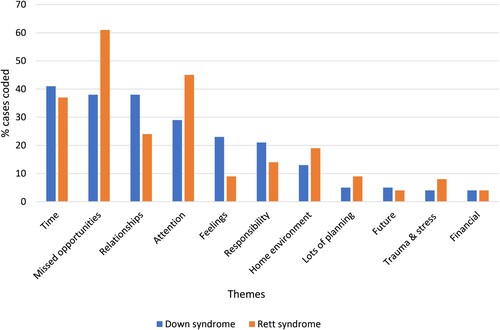
Figure 5. Parent perceived impact of having a child with Down syndrome or Rett syndrome on family recreation activities.
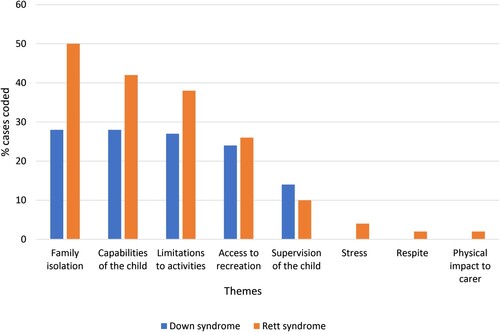
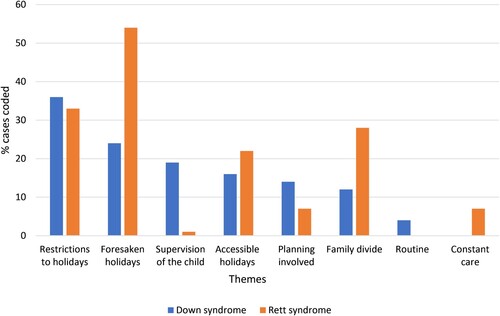
Figure 6. Parent perceived impact of having a child with Down syndrome or Rett syndrome on family holidays.