Figures & data
Table I. Baseline patient characteristics of efficacy analysis dataset.
Figure 1. Flow chart of participants and their eventual disposition.
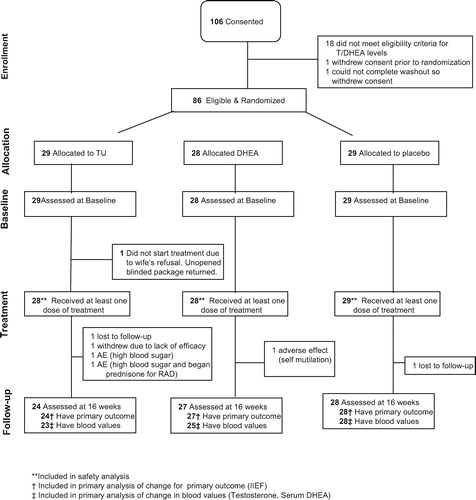
Table II. Change in biochemical values.
Figure 2. Serum T levels (nmol/L) before and upon completion of treatment with TU. Although T levels increased the intra- or inter-group differences were not significant.
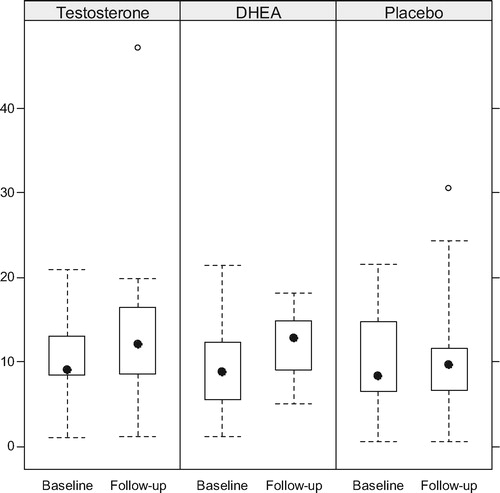
Figure 3. Changes in the levels of serum DHEA. There was a modest increase in the T group and a highly significant increase in the DHEA group.
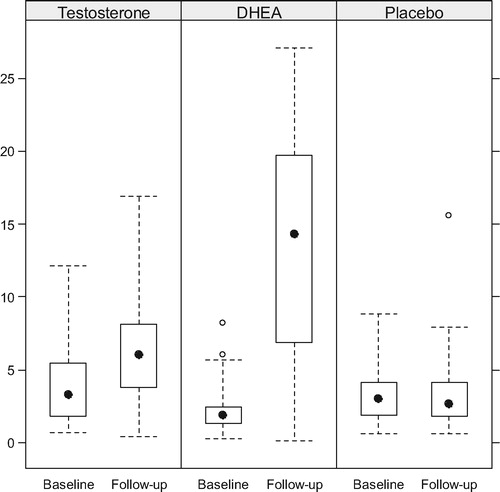
Table III. Comparison of change in IEEF and AMS*.
Figure 4. Total IIEF score in the 3 cohorts at baseline and upon completion.
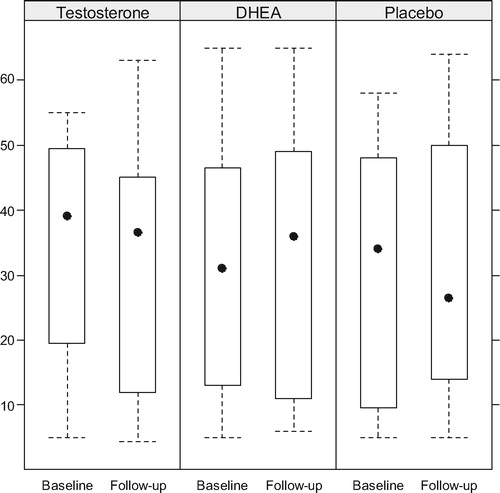
Figure 5. Comparative scores in the desire domain of the IIEF. The differences were barely significant only in the placebo group.
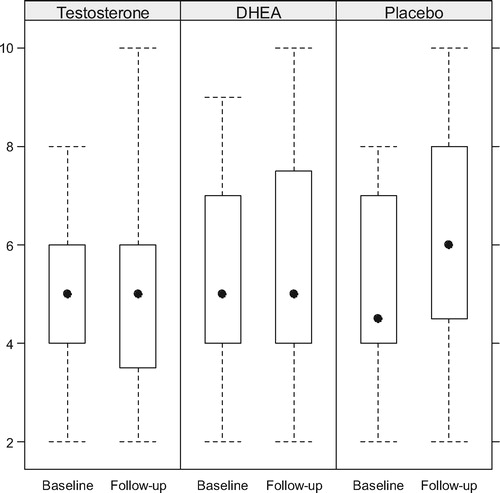
Figure 6. Erectile function domain scores of the IIEF.
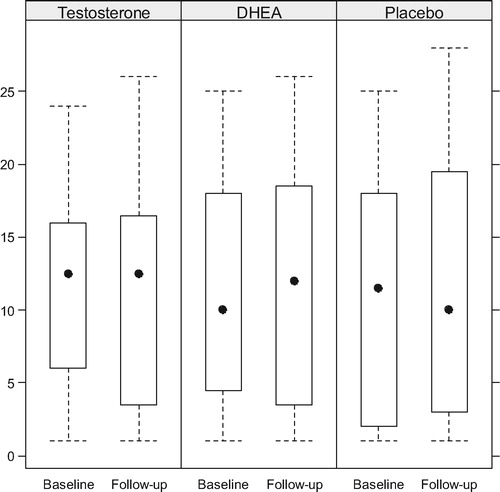
Figure 7. Changes in the AMS scores between baseline and upon completion of the trial.
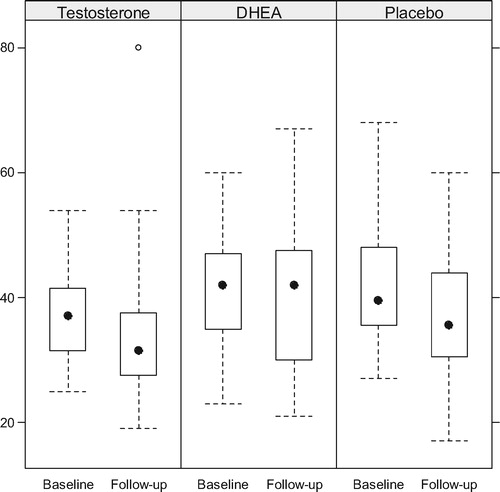
Table IV. Adam questionnaire.
Table V. GAQ at follow-up.