Figures & data
Table 1. Primers used for amplification of SNPs in ESR1 and ESR2, respectively.
Figure 1. Measured levels of total testosterone and free testosterone in men with subnormal levels of both total and free testosterone (×), subnormal levels of total testosterone (○) and men with normal levels of both total and free testosterone (Δ). The cut-off values (11 and 0.18 nmol/L) are indicated by the vertical and horizontal lines, respectively.
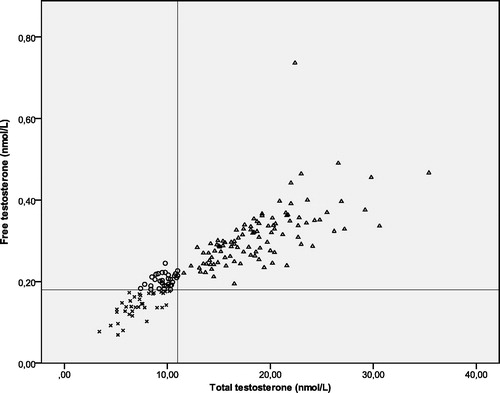
Figure 2. The distribution of E2 in the study population (n = 167).
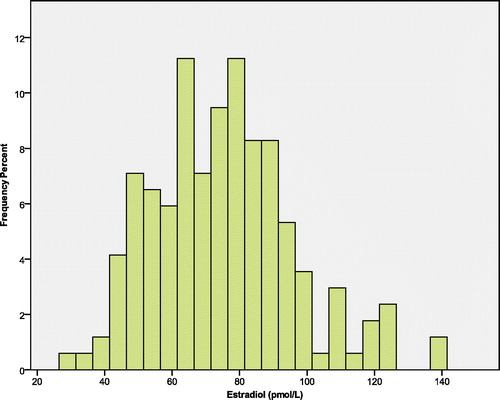
Table 2. Risk of having developed diabetes for carriers of ESR1 variants with normal or subnormal total testosterone concentrations, adjusted for age.
Table 3. Risk of having developed diabetes for carriers of ESR1 variants with normal or subnormal free testosterone concentrations, adjusted for age.
Table 4. Risk of having developed diabetes for carriers of ESR2 variants with normal or subnormal total testosterone concentrations, adjusted for age.
Table 5. Risk of having developed diabetes for carriers of ESR2 variants with normal or subnormal free testosterone concentrations, adjusted for age.