Figures & data
Table 1. Demographic data and characteristics of the initial participant sample (N = 176).
Table 2. Partial correlation coefficient of the HADS and AMS scores.
Figure 1. (a) Psychological symptoms, (b) somatic symptoms and (c) sexual symptoms.
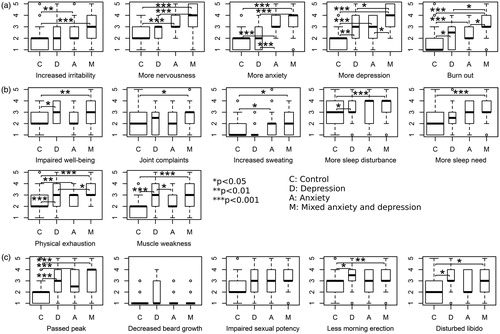
Table 3. Demographic differences in groups of emotional distress.
Table 4. Analysis of variance (ANOVA) of AMS scores in groups of emotional distress.