Figures & data
Table 1. Clinical characteristics and therapeutic strategy of study subjects (mean±SD).
Table 2. CGM variables of study subjects (mean ± SD).
Figure 1. Prevalence of nocturnal hypoglycemia categorized by quartiles of fasting glucose (A) or bedtime glucose (B).
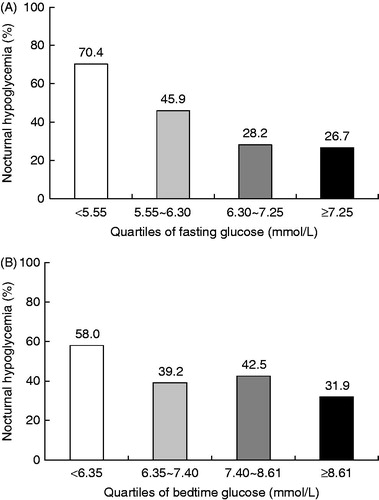
Table 3. Association between fasting glucose or bedtime glucose and nocturnal hypoglycemia.
Figure 2. Area under the ROC curve for fasting glucose or bedtime glucose predicting nocturnal hypoglycemia. Using the area under receiver operating characteristic (ROC) curve, fasting glucose but not bedtime glucose, was a predictor of nocturnal hypoglycemia, with an area under the ROC curve (AUC) of 0.714 (95%CI: 0.653 ∼ 0.774, p < 0.001) and 0.604 (95%CI: 0.538∼0.670, p = 0.002).
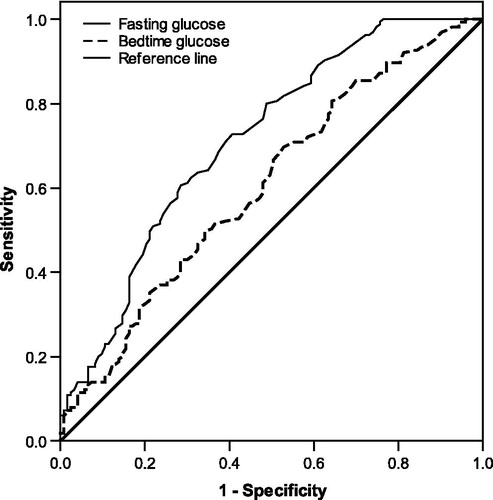
Table 4. Optimal cutpoint of fasting glucose or bedtime glucose predicting nocturnal hypoglycemia.