
Figures & data
Figure 1. Flow chart of subject disposition. ADR, adverse drug reaction; AMS, Aging Males’ Symptoms scale. aAn overall total of 337 subjects lacked AMS scores at both baseline and the 6-month visit. This number includes all those who discontinued the study in addition to the 83 who completed the study, but lacked AMS scores.
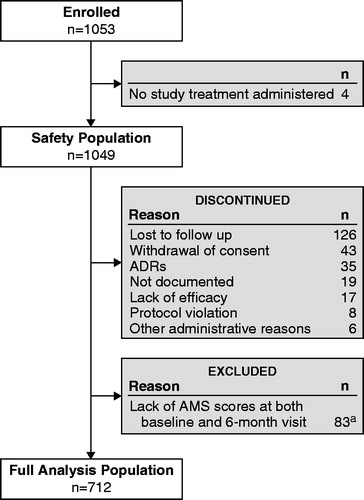
Table 1. Baseline demographics and characteristics of responders and nonresponders.
Figure 2. Flow chart showing T data at baseline and after 6 months of treatment. CRF, case report form; T, testosterone.
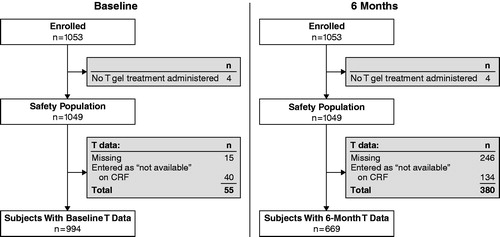
Figure 3. Change in mean AMS total scores over 6 months according to responder status. AMS, Aging Males’ Symptoms scale. Error bars are standard error of mean.
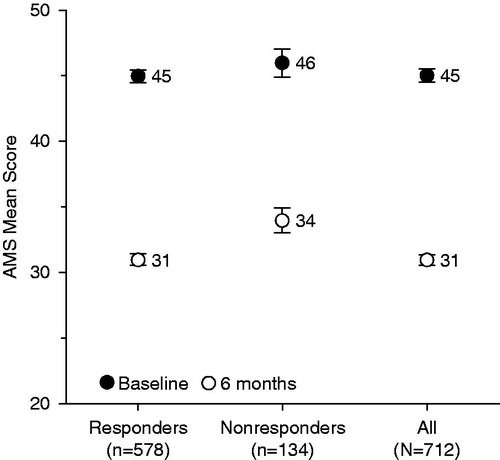
Figure 4. Change in mean AMS total scores over 6 months according to age quartile. AMS, Aging Males’ Symptoms scale. Error bars are standard error of mean.
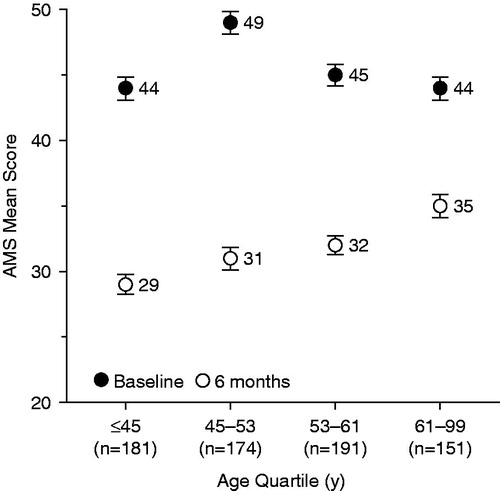
Figure 5. Change in IIEF total scores over 6 months according to responder status. IIEF, International Index of Erectile Function. Error bars are standard error of mean.
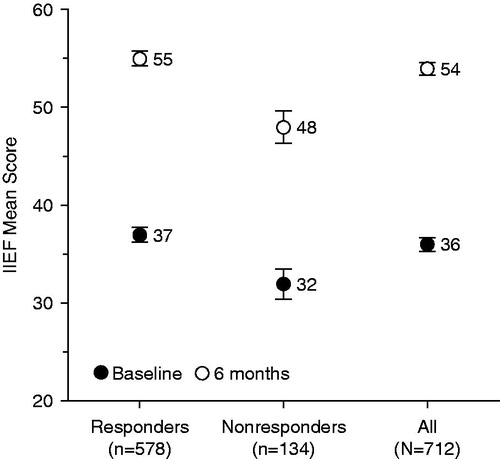
Figure 6. Changes in IIEF and MFI total scores over 6 months for the overall population (n = 712). p < 0.0001 versus baseline for all visits for both IIEF and MFI total scores. IIEF, International Index of Erectile Function; MFI, Multidimensional Fatigue Inventory. Error bars are standard error of mean.
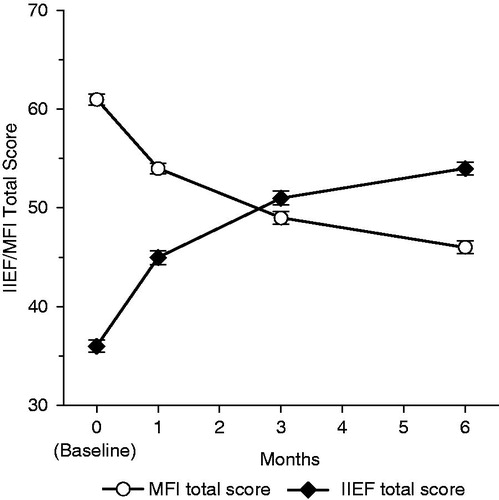
Figure 7. Change in IIEF total scores over 6 months according to age quartile. IIEF, International Index of Erectile Function. Error bars are standard error of mean.
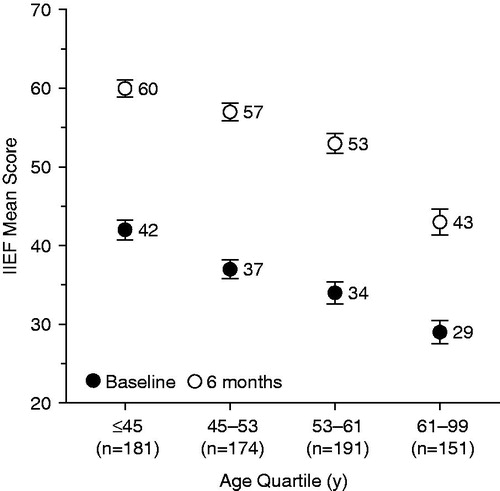
Figure 8. Change in mean MFI total scores over 6 months according to responder status. MFI, Multidimensional Fatigue Inventory. Error bars are standard error of mean.
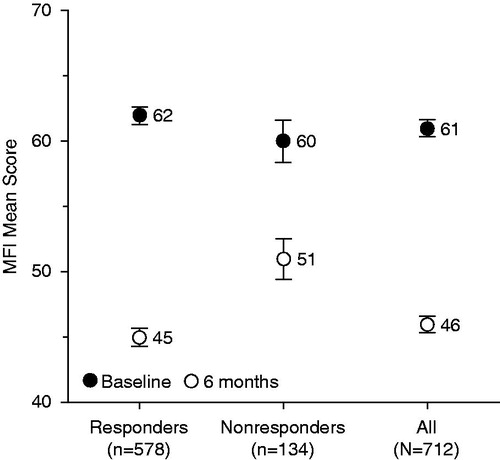
Figure 9. Change in mean MFI total scores over 6 months according to age quartile. MFI, Multidimensional Fatigue Inventory. Error bars are standard error of mean.
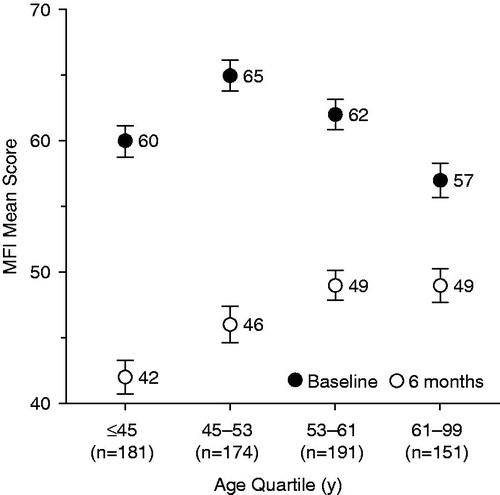
Figure 10. Change in (a) mean BMI and (b) waist circumference over 6 months according to responder status. BMI, body mass index. Error bars are standard error of mean.
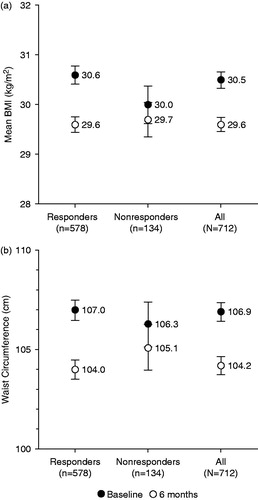
Figure 11. Changes in BMI and waist circumference values over 6 months for the overall population (n = 712). p < 0.0001 versus baseline for all visits for both BMI and waist circumference. BMI, body mass index. Error bars are standard error of mean.
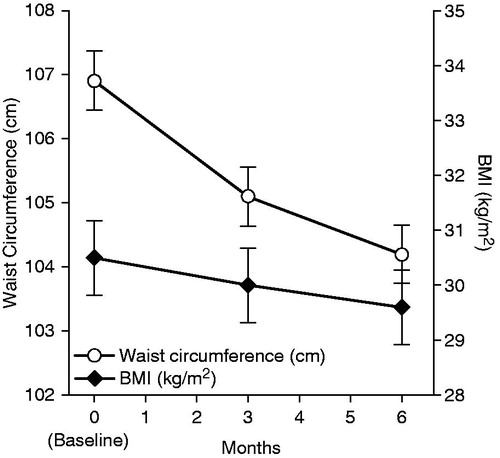
Table 2. Summary of qualitative laboratory parameters for PSA, hemoglobin, and hematocrit (n = 1049).