
Figures & data
Figure 1. Study design.
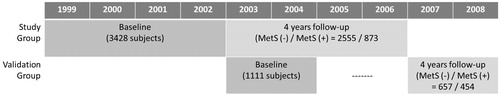
Figure 2. Receiver-operating characteristic (ROC) analysis showing WBC level cutoff point (black square) used to predict metabolic syndrome in the study group. (a) Males. (b) Females.
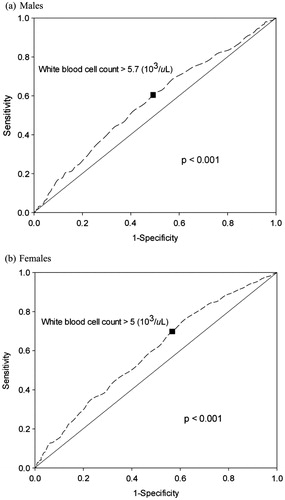
Figure 3. Kaplan–Meier estimates of metabolic syndrome during follow-up according to the white blood cell levels predicting at baseline in validation group.
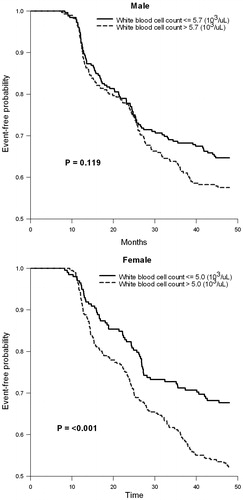
Table 1. Demographic data of the study group and validation group at baseline and follow-up.
Table 2. Univariate and multivariate analyses of baseline white blood cell levels and metabolic-related components at follow-up in the study group.
Table 3. Cox regression between baseline variables, white blood cell levels, and components of MetS and whether subjects had MetS after follow-up.
Table 4. The κ coefficient test between predicted and observed metabolic syndrome in the validation group.