Figures & data
Figure 1. The relationships between metabolic diseases and the incidence rates of different vascular diseases. (A) The incidence rates of each metabolic diseases in populations with different vascular diseases. The rankings are arranged from low to high according to the incidence rates in the control group. *p < 0.05, **p < 0.01 versus the group without vascular diseases. (B) Comparisons of the numbers of metabolic diseases in populations with different vascular diseases. (C) The incidence rates of different vascular diseases in populations with different metabolic diseases. Hypertension increased the risk of CAVD and BVD, while dyslipidemia increased the risk of CAVD (shown by OR value and 95% CI). (D) The incidence rates of different vascular diseases in groups of different numbers of metabolic diseases. Patients with 3, 4 or 5 abnormal metabolisms had significant high risk of CAVD (shown by OR value and 95% CI). VD: vascular diseases; CEVD: cerebrovascular disease; CAVD: cardiovascular disease; BVD: both CEVD and CAVD.
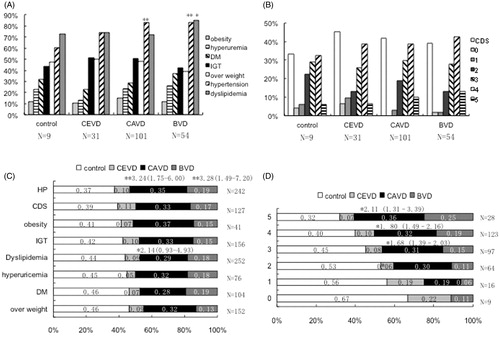
Table 1. Differences in sex hormone levels after grouping the subjects according to vascular disease.
Table 2. Logistic regression analyses of different vascular disease group.
Figure 2. CEVD ROC curves and tangent points of metabolic and gonadal risk factors. (A) CEVD positive ROC curve. (B) ROC curve of FE2. (C) Patients were divided into two groups with C-peptide = 2.43 as the tangent point. The CEVD incidence rates in these groups were significantly different (p = 0.01). (D) Quartile-based analyses. “Q4:Q1–3” means the CEVD risk in Q4, compared to the pooled results from Q1–3.
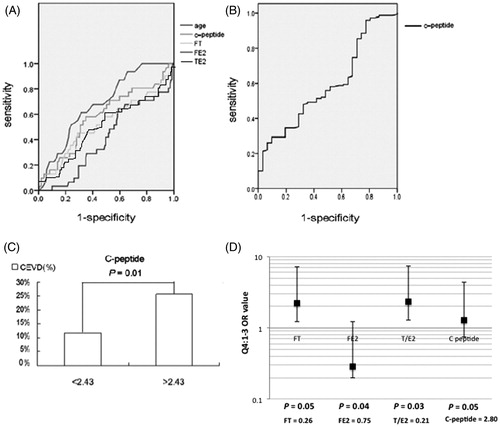
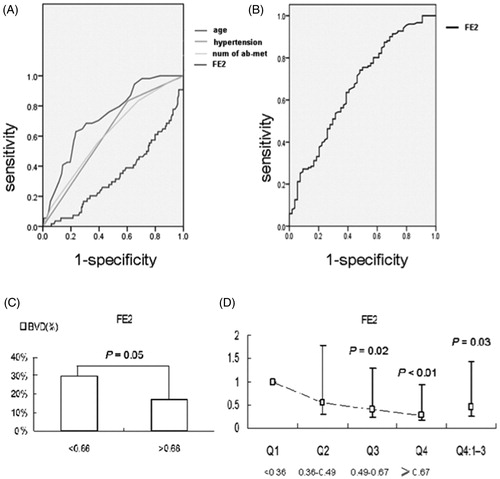
Figure 3. BVD ROC curves and tangent points of metabolic and gonadal risk factors. (A) BVD positive ROC curve. (B) ROC curve of FE2. (C) Patients were divided into two groups with FE2 = 0.66 as the tangent point. The BVD incidence rates in these groups were significantly different (p = 0.01). (D) Using men in quartile 1 (Q1) as a reference, the BVD risks in Q2, Q3, Q4 and “Q4:Q1–3” are shown.