Figures & data
Table 1. Demographic characteristics of the population.
Table 2. Correlation between age, BMI, waist circumference, WHR and androgen levels.
Figure 1. Correlation between age and total testosterone (r: −0.102, p 0.028).
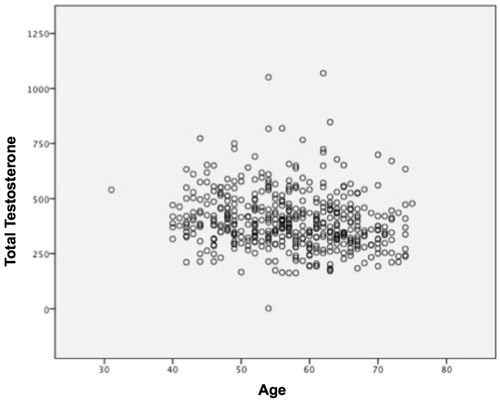
Figure 2. Correlation between age and free calculated testosterone (r: −0.151, p < 0.001).
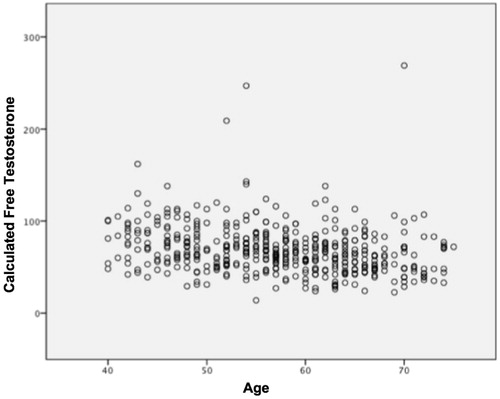
Figure 3. Variation in total testosterone levels among patients (ADAM positive and ADAM negative).
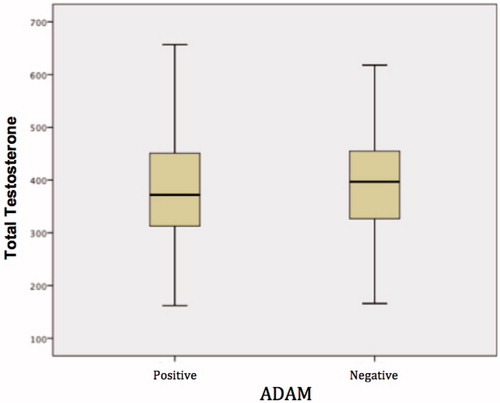
Figure 4. Variation in free calculated testosterone levels among patients (ADAM positive and ADAM negative).
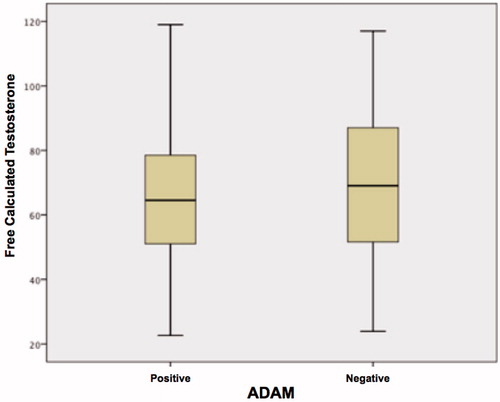
Table 3. Comparison of the androgen levels in patients ADAM positive and ADAM negative.
Figure 5. ROC curve of the ADAM questionnaire for free calculated testosterone <65 pg/ml. Area under the curve = 0.53 (p < 0.029).
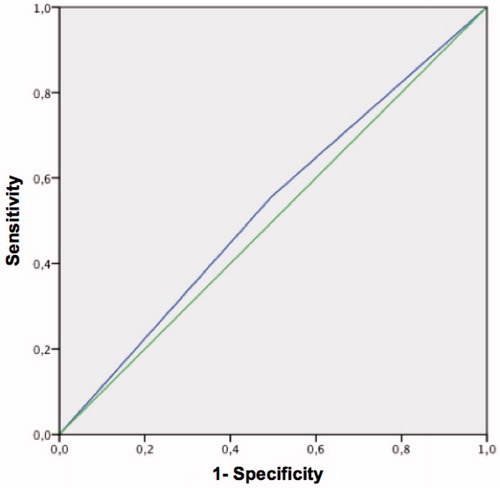
Figure 6. ROC curve of the MMAS questionnaire for free calculated testosterone <65 pg/ml. Area under the curve = 0.513 (p < 0.05).
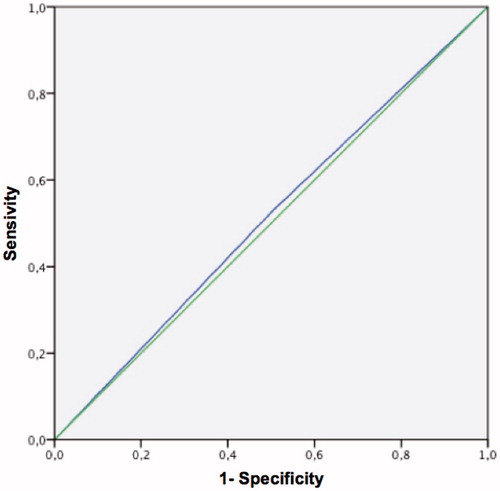
Figure 7. Variation in total testosterone levels among patients (MMAS positive and MMAS negative).
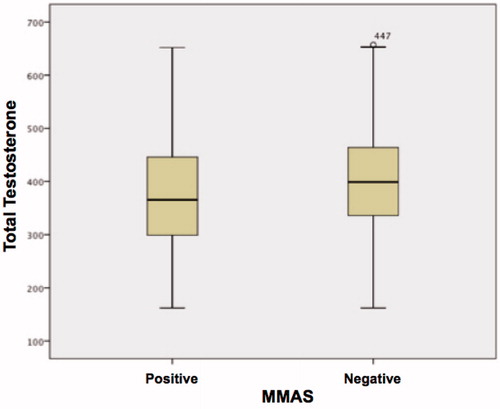
Figure 8. Variation in free calculated testosterone levels among patients (MMAS positive and MMAS negative).
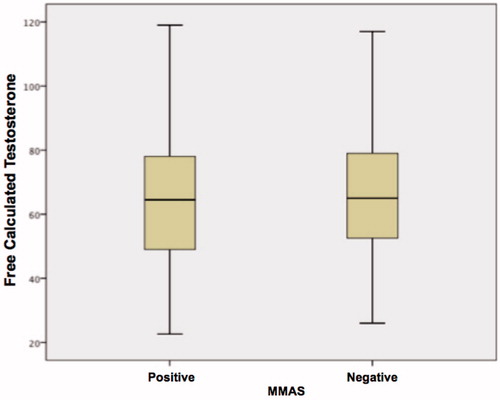
Table 4. Comparison of age, hormone levels, BMI, WHR and waist circumference between patients with normal and anormal score in MMASq.
Table 5. Evaluation of the ADAM questionnaire × total testosterone.
Table 6. Evaluation of the ADAM questionnaire × free calculated testosterone.
Table 7. Evaluation of the MMAS questionnaire × total testosterone.
Table 8. Evaluation of the MMAS questionnaire × free calculated testosterone.
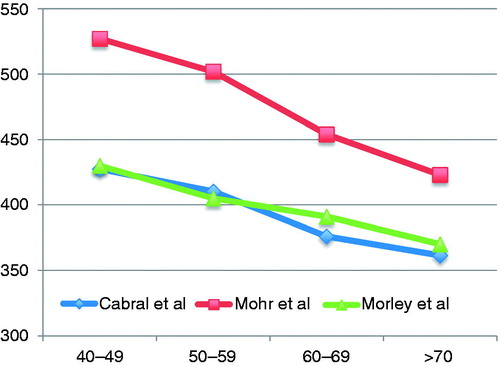
Figure 9. Total testosterone by age group (compared with Mohr et al. and Morley et al.).