
Figures & data
Table 1. Characteristic of patients with LOH and control group.
Figure 1. The prevalence (%) of normoglycemia, prediabetes and T2DM in patients with LOH and in control group. T2DM – diabetes mellitus type 2.
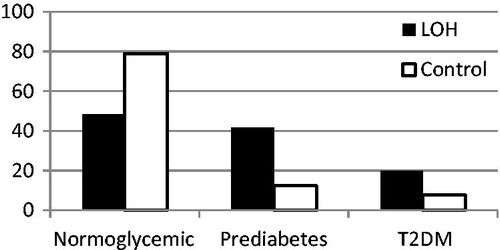
Table 2. Total and free testosterone concentrations in the LOH group after dividing according to glycemic control disorders.
Table 3. Comorbidities (no.pts.;%) in all LOH patients, prediabetic and normoglycemic subgroup and in the control group.