Figures & data
Table 1. Comparisons of general characteristic data for different age groups.
Figure 1. Age-related changes in BMD at the lumbar spine, total hip and femoral neck.
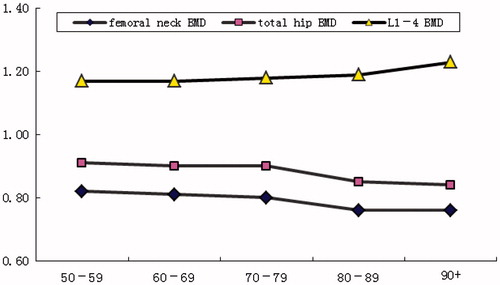
Table 2. Age-related changes in BMD in the lumbar spine, total hip and femoral neck.
Table 3. The percentages of osteoporosis, osteopenia and normal bone mass in all age groups.
Figure 2. Comparisons of osteoporosis, osteopenia and normal bone mass detection rates between the under-70 and over-70 age groups.
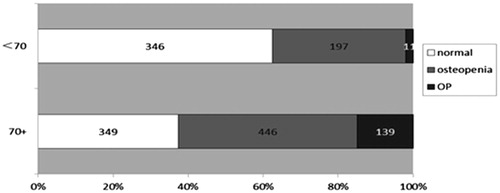
Figure 3 (A) Correlation of the femoral neck BMD with age. (B) Correlation of the total hip BMD with age. (C) Correlation of the lumbar spine BMDwith age.
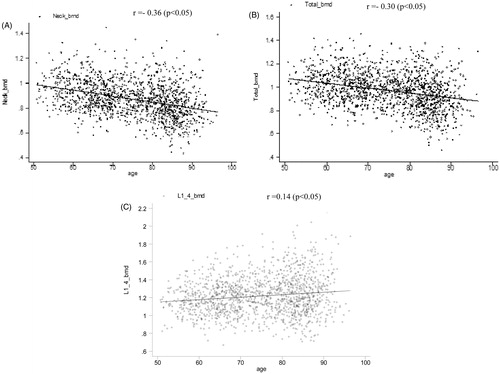
Table 4. Logistic regression analysis.
Table 5. The diagnostic value of OSTA index ≤−1 for osteoporosis and osteopenia.
Table 6. The diagnostic value of OSTA index ≤−4 for osteoporosis and osteopenia.
Figure 4. The proportion of risk groups among the different age groups.
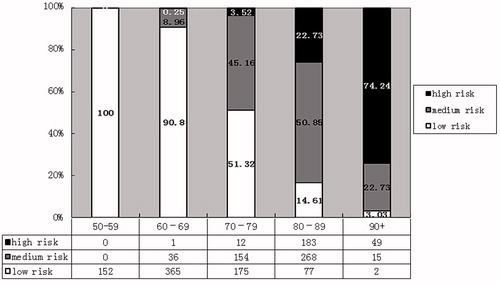
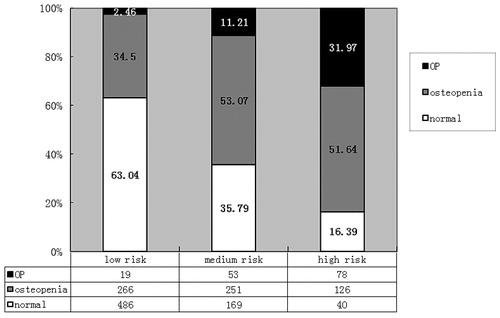
Figure 5. The proportion of subjects with osteoporosis, osteopenia and normal bone mass in different risk groups.