Figures & data
Table 1. Prostate tissue oxidative stress-related parameters analyzed.
Figure 1. Protein oxidation biomarkers in prostate tissue of naturally aged rats (NA; n = 10), and their corresponding young controls (YC; n = 8). (A) PCO, (B) AOPP, (C) P-SH. Results are expressed as mean ± S.E.M. Data are statistically different between groups, *p < 0.05, **p < 0.01; PCO, protein carbonyl groups; AOPP, advanced oxidation protein end products; P-SH, protein thiol groups; pr, protein.
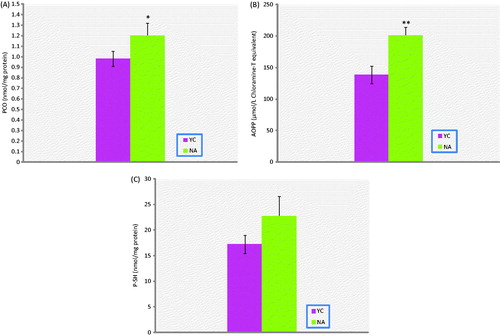
Figure 2. Lipid peroxidation status in prostate tissue of naturally aged rats (NA; n = 10) and their corresponding young controls (YC; n = 8). Results are expressed as mean ± S.E.M. Data are statistically different between groups, *p < 0.05; LHP, lipidhydroperoxides.
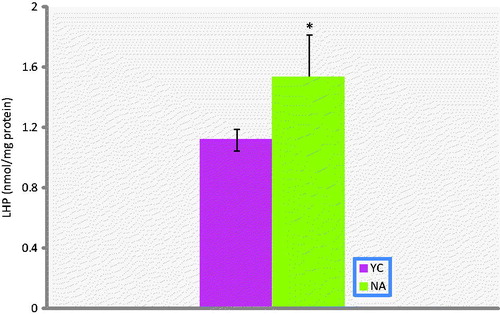
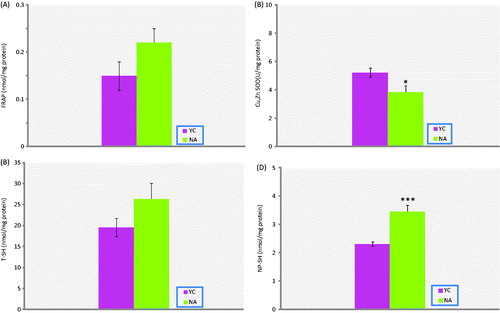
Figure 3. Antioxidant capacity biomarkers in prostate tissue of naturally aged rats (NA; n = 10) and their corresponding young controls (YC; n = 8). (A) FRAP, (B) Cu-Zn-SOD, (C) TSH, (D) NP-SH. Results are expressed as mean ± SEM. Data are statistically different between groups, *p < 0.05, ***p < 0.001; FRAP, ferric reducing/antioxidant power; Cu-Zn-: Cu-Zn-superoxide dismutase; T-SH, total thiol groups; NP-SH, non-protein thiol groups.