Figures & data
Table 1. Genes of interest in the current study.
Figure 1. Serum testosterone level of the study groups. Orchidectomy was performed at week 0 and all rats were sacrificed at week 8. Testosterone enanthate at 7 mg/kg body weight was administered to the TE group for 8 weeks. Testosterone level decreased with orchidectomy and increased with testosterone enanthate treatment. #Indicates significant difference (p < 0.05) versus week 0 within the treatment group. *Indicates significant difference (p < 0.05) versus the SH group at week 8.
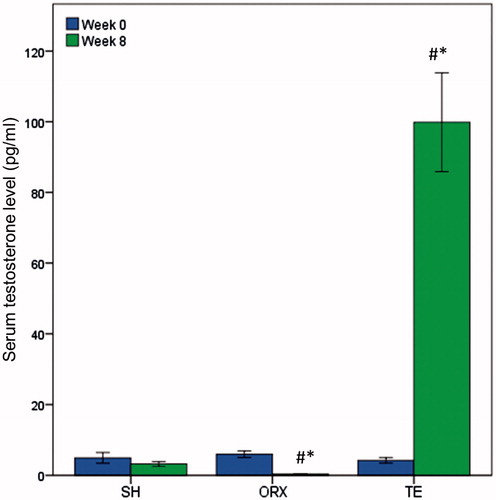
Figure 2. The trabecular structure at the proximal tibia of the rats in each study group. The image was obtained after 8 weeks of treatment and reconstructed using a μCT device. The trabecular structure of the ORX group was more porous compared to the SH and TE group.
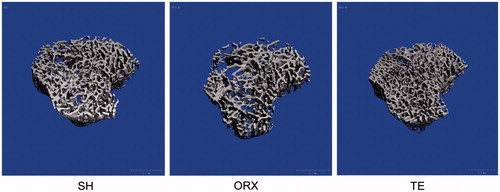
Table 2. Trabecular structural indices of the study group.
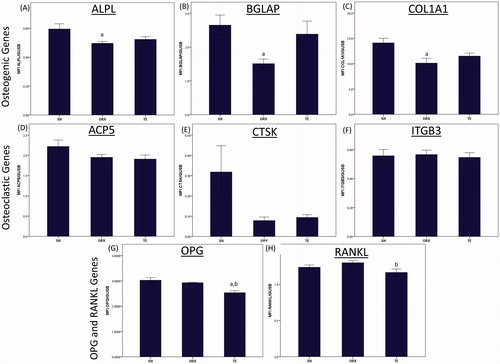
Figure 3. The gene expression of the study groups. Gene expression was measured from sample extracted from the metaphysial region of distal tibia using multiplex quantigene technique. The mRNA expression of the target gene was normalized with the mRNA expression of beta-glucuronidase. Orchidectomy decreased the expression of osteogenic genes significantly (p < 0.05). Testosterone treatment significantly decreased the gene expressions of OPG and RANKL (p < 0.05). Letter ‘a’ indicates significant difference (p < 0.05) versus the SH group; ‘b’ indicates significant difference (p < 0.05) versus the ORX group.