Figures & data
Table 1. Crude drug composition of SKRBT.
Table 2. Primary and secondary antibodies used for immunofluorescence analysis.
Figure 1. Effects of SKRBT on the levels of serum testosterone (n = 12 per group). All values are mean ± SEM, *p < 0.05 compared with control group.
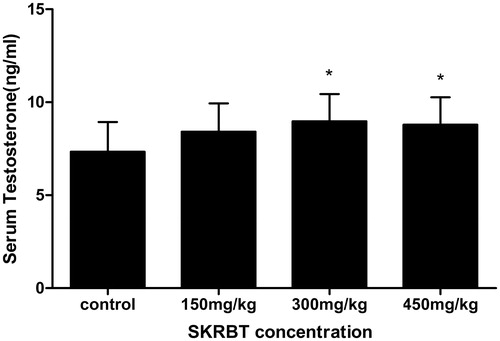
Figure 2. Measures of sexual behavior of control group and SKRBT treated groups (n = 12 per group). All values are mean ± SEM, #p < 0.01,*p < 0.05 compared with control group. (A) Mean latency in minutes of mount, intromission and ejaculation. (B) Mean frequency per minute of mount, intromission and mean copulatory efficacy per minute.
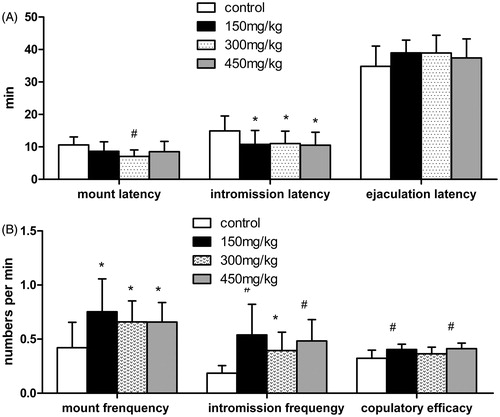
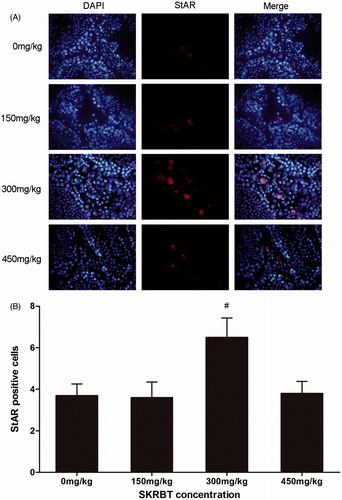
Figure 3. Mice were treated with SKRBT every day for three weeks and then the testes were harvested for fluorescent immunohistochemistry to identify the StAR-positive Leydig cells in interstitial spaces. (A) The number of StAR-positive cells (n = 12 per group) was determined. I = interstitial spaces, T = seminiferous tubules. Magnification ×400. (B) The number of StAR-positive cells per interstitial space. Results are shown as mean ± SEM (n = 12).