Figures & data
Table 1. Baseline characteristics.
Figure 1. Mean ± standard error (SE) total International Prostate Symptom Score (IPSS) over time for testosterone undecanoate 80–240 mg/day versus placebo.
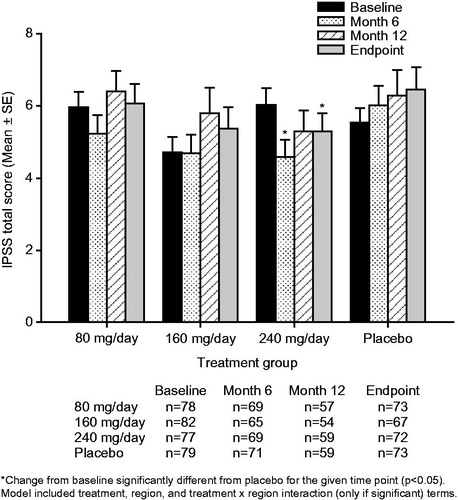
Figure 2. Mean ± standard error (SE) International Prostate Symptom Score (IPSS) quality of life subscore over time for testosterone undecanoate 80–240 mg/day versus placebo. Decrease in score = improvement.
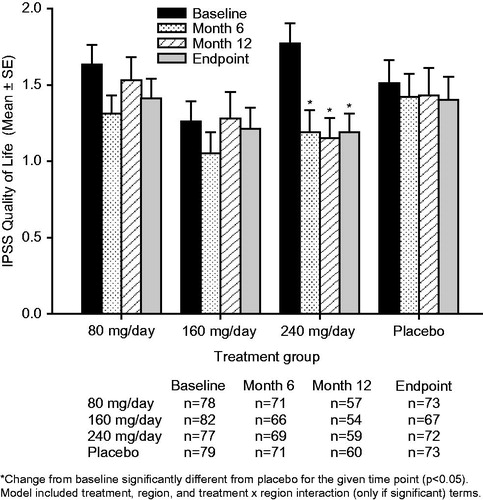
Figure 3. Mean ± standard error (SE) International Prostate Symptom Score (IPSS) storage subscore over time for testosterone undecanoate 80–240 mg/day versus placebo.
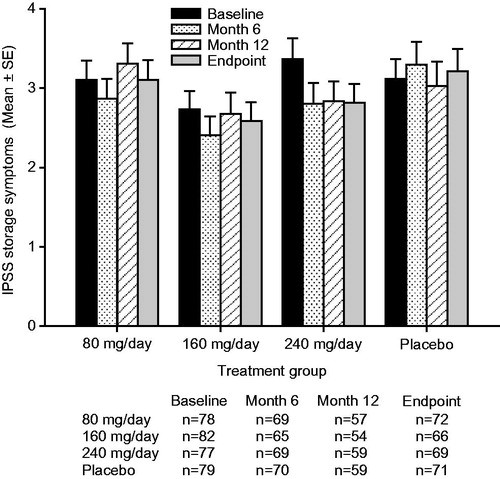
Figure 4. Mean ± standard error (SE) International Prostate Symptom Score (IPSS) voiding subscore over time for testosterone undecanoate 80–240 mg/day versus placebo.
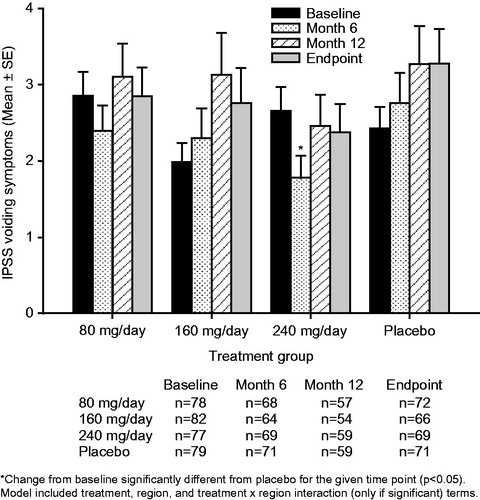
Table 2. Placebo-adjusted change from baseline in prostate-related measurements following treatment with testosterone undecanoate for up to 12 months (all subjects treated).
Table 3. Number (%) and mean change from baseline in IPSS quality of life score of patients who had a clinically significant improvement, no clinically significant change, or clinically significant deterioration from baseline in IPSS total score at study endpoint.
Figure 5. Mean ± standard error (SE) prostate serum antigen (PSA) over time for testosterone undecanoate 80–240 mg/day versus placebo.
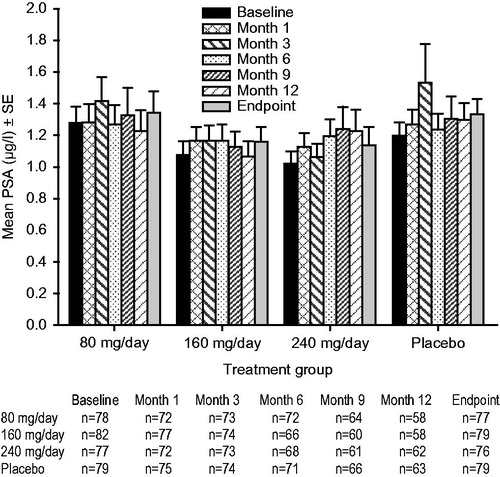
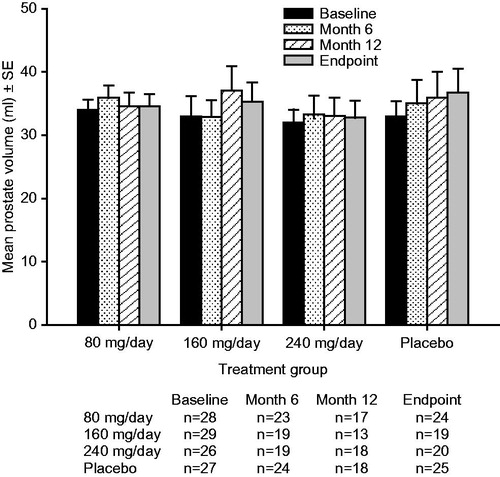
Figure 6. Mean ± standard error (SE) prostate volume over time for testosterone undecanoate 80–240 mg/day versus placebo.