Figures & data
Figure 1. (a) Pre-treatment total testosterone levels, showing marked skewing to the left of the normal distribution curve. (b) The log-normal distribution of all pre-treatment blood total testosterone levels.
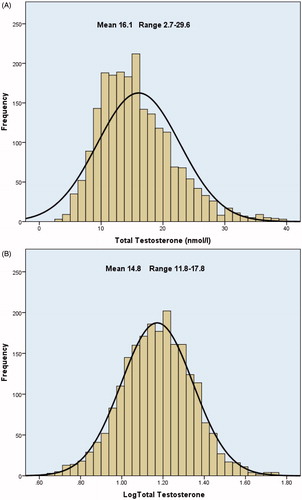
Figure 2. Lack of relationship between pre-treatment total ACL symptom scores and levels of total testosterone.
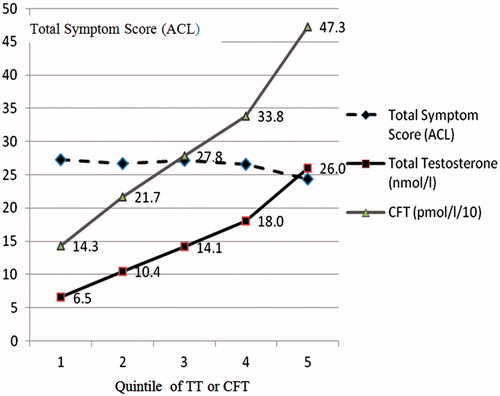
Figure 3. Symptomatic response over 12 years for patients presenting with TT ≤12 nmol/l and those >12 nmol/l.
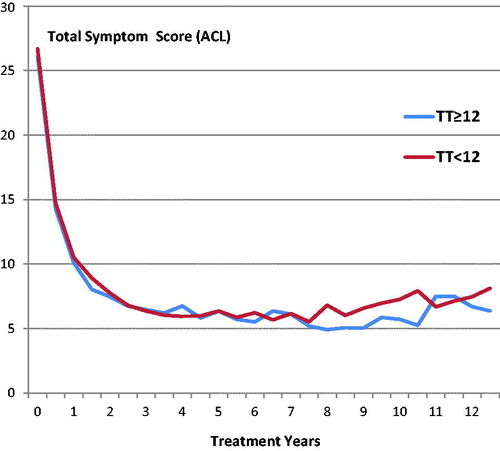
Table 1. Symptom score and endocrine changes between the initial visit and after 1 year, on treatment with seven different testosterone preparations: ACL Total Symptom Score, TT total testosterone (nmol/l), SHBG sex hormone binding globulin (nmol/l), E2 estradiol (pmol/l), LH luteinizing hormone (IU/l), FSH follicle stimulating hormone (IU/l).
Table 2. Glucose and lipid changes between the initial visit and after 1 year, on treatment with seven different testosterone preparations: Gluc (glucose, mmol/l), TG (triglycerides, mmol/l), Tchol (total cholesterol mmol/l), HDL Chol (high-density lipoprotein, mmol/l) and ratio (total cholesterol/HDL ratio).
Table 3. Changes in BMI (body mass index, kg/m2), systolic and diastolic blood pressure (mm Hg), pulse rate (BPM), Hb (hemoglobin, g/dl) and HCT (hematocrit) between the initial visit and after 1 year on treatment with seven different testosterone preparations.
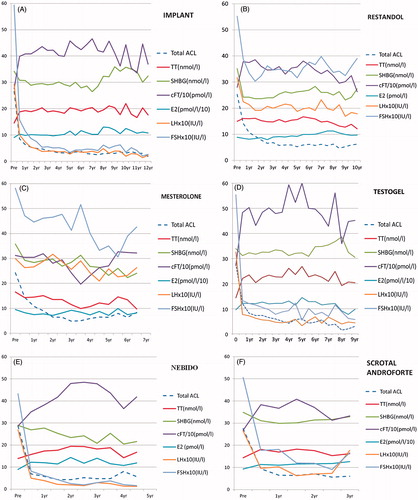
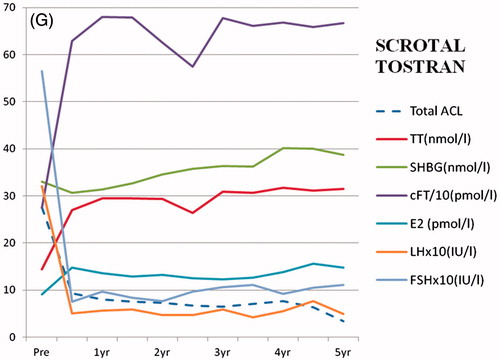
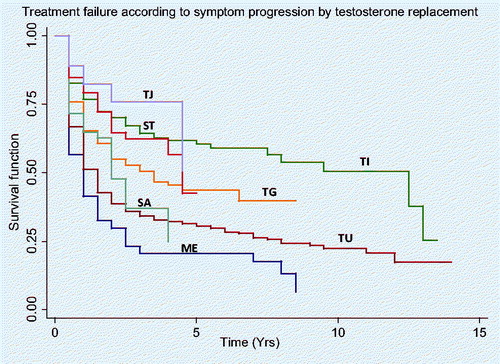
Figure 5. Kaplan–Meier retention estimates by treatment preparation (TI = testosterone implant, TU = oral testosterone undecanoate, ME = mesterolone, TG = testogel, TJ = Nebido, SA = Scrotal Andromen and ST = Scrotal Tostran).