
Figures & data
Figure 1. Flow Diagram of included studies.
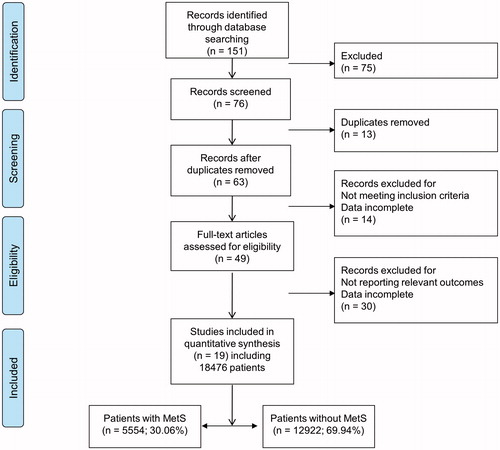
Table 1. Studies on the association between MetS components, and LUTS.
Figure 2. International Prostate Symptom Score (IPSS) (A), Voiding IPSS (B), Storage IPSS (C) and prostate volume (D) in patients with and without metabolic syndrome (MetS). CI=confidence interval; SD=standard deviation.
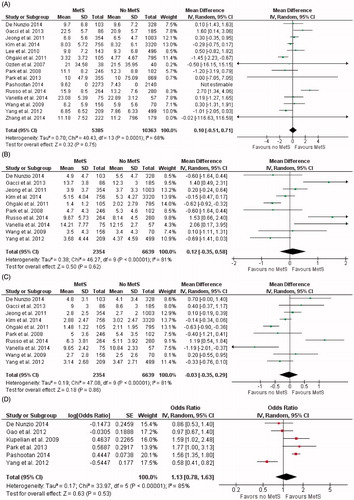
Figure 3. Risk of having moderate-to-severe lower urinary tract symptoms (IPSS ≥ 8) expressed as odds ratio (OR [95% CI]) in patients with metabolic syndrome (A), in patients with waist circumference ≥90 cm (or ≥ 90 cm for Asians) (B), with HDL < 40 mg/dl (C), with triglycerides ≥ 150 mg/dl (D), in patients with elevated fasting glucose (≥6.1 mmol/L or 110 mg/dL) (E).CI = confidence interval; Homa-index = homeostatic model assessment index.
![Figure 3. Risk of having moderate-to-severe lower urinary tract symptoms (IPSS ≥ 8) expressed as odds ratio (OR [95% CI]) in patients with metabolic syndrome (A), in patients with waist circumference ≥90 cm (or ≥ 90 cm for Asians) (B), with HDL < 40 mg/dl (C), with triglycerides ≥ 150 mg/dl (D), in patients with elevated fasting glucose (≥6.1 mmol/L or 110 mg/dL) (E).CI = confidence interval; Homa-index = homeostatic model assessment index.](/cms/asset/2562133c-93f1-484b-a491-27b2c79158c1/itam_a_1062980_f0003_c.jpg)