Figures & data
Table 1. Demographic and clinical characteristics of the sample (N = 1787).
Table 2. Abridged summary per item report of invariant item ordering of the AMS scale.
Figure 1. The person-item map of the 5-item psychosomatic subscale of the AMS-6.
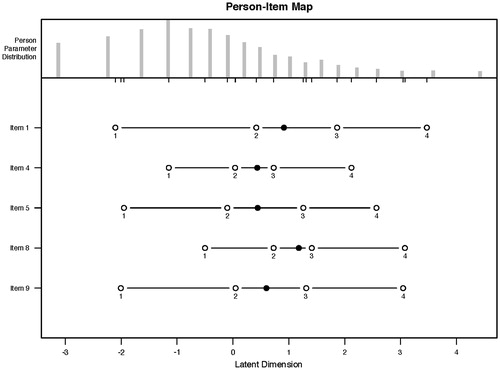
Figure 2. The plot of person parameters (θ) against the raw scores of the 5-item psychosomatic subscale of the AMS-6.
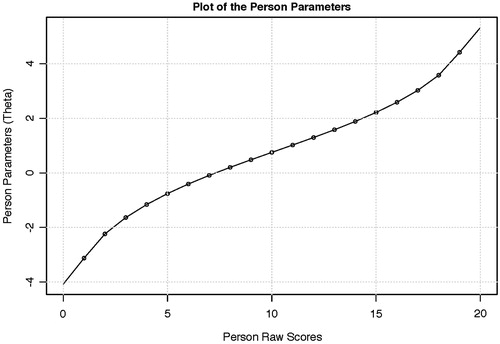
Table 3. Item fit statistics of Rasch analysis of the remaining 5 items on the AMS scale.
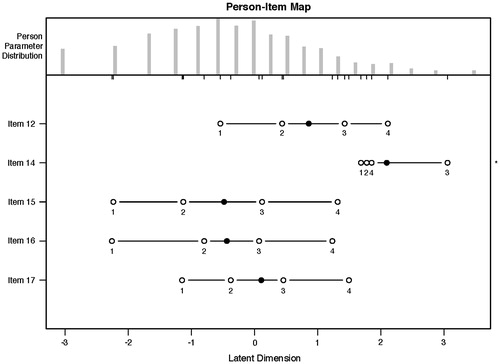
Figure 3. The person-item map of the five sexual symptoms of the AMS.