Figures & data
Table 1. Characteristics of patients.
Figure 1. Relationship between PV and age. PV showed no correlation with age (r = 0.071, p = 0.290, N = 226). However, in patients under 70 years old, there was a significant positive correlation between PV and age (r = 0.284, p = 0.008, N = 85).
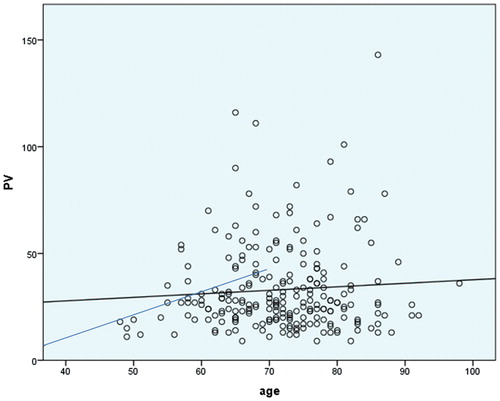
Table 3. Pearson correlations between PV (all, ≤25, >25) and the variables.
Figure 2. Correlation between PV and sex hormones. (a) PV and testosterone (r = 0.149, p = 0.025), (b) PV and E2 (r = 0.112, p = 0.094), (c) PV and DHEAS (r = −0.071, p = 0.290). PV significantly correlated with testosterone. N = 226.
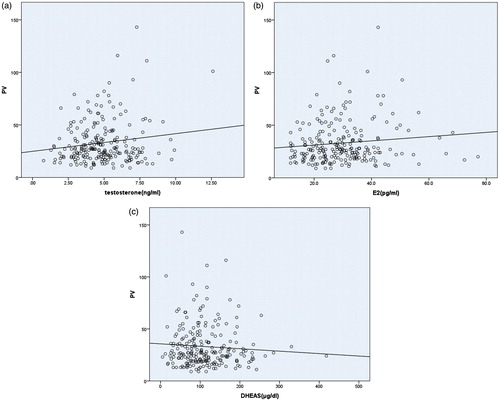
Table 2. Pearson correlations between variables of all patients.
Table 4. Pearson correlations between PV and sex hormone ratios.
Figure 3. Correlation between sex hormones. (a) E2 and testosterone (r = 0.343, p = 0.000), (b) DHEAS and E2 (r = 0.044, p = 0.508), (c) DHEAS and testosterone (r = 0.003, p = 0.968). E2 significantly correlated with testosterone. N = 226.
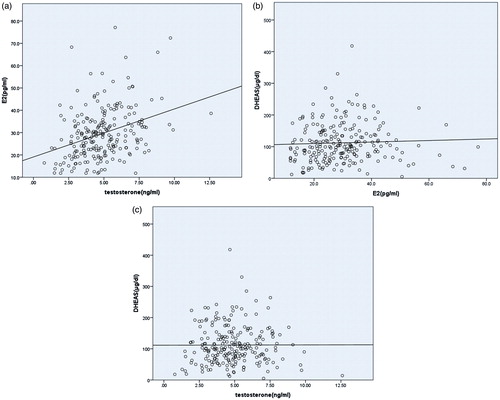
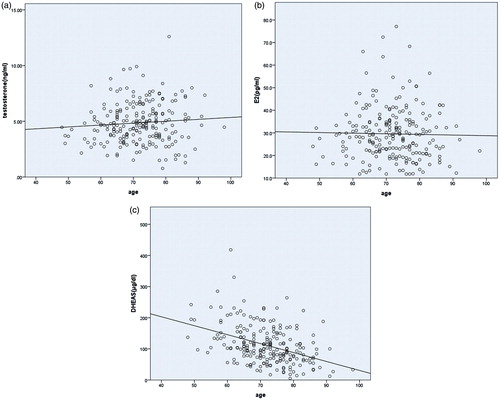
Figure 4. Relationship between sex hormones and age. (a) testosterone (r = 0.082, p = 0.218), (b) E2 (r = −0.021, p = 0.749), (c) DHEAS (r = −0.409, p = 0.000). DHEAS significantly correlated with age. N = 226.