Figures & data
Fig 1. The structure of N-mannan (including phosphomannan) and O-linked mannan of C. albicans. The different glycosyl linkages are shown as different colored hexagons and the point of truncation of the various mutants used in this study is indicated by arrows. The extent of truncation of the N-mannan α-1,6 mannose backbone in the pmr1Δ mutant is not fixed, and does not remove all of the outer chains, as in the och1Δ mutant. See references [Citation23–26].
![Fig 1. The structure of N-mannan (including phosphomannan) and O-linked mannan of C. albicans. The different glycosyl linkages are shown as different colored hexagons and the point of truncation of the various mutants used in this study is indicated by arrows. The extent of truncation of the N-mannan α-1,6 mannose backbone in the pmr1Δ mutant is not fixed, and does not remove all of the outer chains, as in the och1Δ mutant. See references [Citation23–26].](/cms/asset/a85396d5-0791-4ef3-8c12-89181048ecd0/immy_a_551425_f0001_b.jpg)
Table 1 Candida albicans strains used in this study.
Fig 2. FACS assay for binding and phagocytosis and validation confocal fluorescence microscopy. Test co-incubation samples of C. albicans and PMNs (ratio 3:1) were analyzed by FACS (SI Materials and Methods – online only). (A) A scatter-graph of PMN associated-C. albicans cells plotted as a function of FITC versus CFW fluorescence intensities. Two sub-populations of fungal cells are resolved, corresponding to engulfed (quadrant Q1-2) and adhered (quadrant Q2-2) C. albicans cells. PMNs not associated with C. albicans cells were excluded from the analysis by FACS software. (B) Confocal fluorescence microscopic images of representative sorted cells from quadrants Q1-2 and Q2-2 validating the FACS analysis and gating strategy. Engulfed, FITC-labeled C. albicans cells are visible in the upper-left quadrant, whilst PMNs with adhered fungal cells stained with the cellwall specific dye CFW are shown in the upper-right quadrant. PMNs not associated with C. albicans cells were sorted and visualized (lower-left quadrant), thereby validating the selection of the PMN-specific antibody.
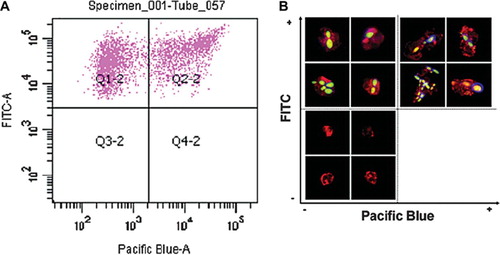
Fig 3. Analysis of binding and phagocytosis of C. albicans glycosylation-deficient mutant strains by FACS. Bars indicate the percentage of C. albicans cells associated with, bound to, or engulfed by human PMNs following 30 min of co-incubation at 37°C. The solid bars represent the percentage of C. albicans yeast cells (as a proportion of the total C. albicans cells counted) co-sorting with PMNs. This reflects differences in the recognition and binding of the various C. albicans strains by PMNs. Grey bars show the percentage of C. albicans yeast cells adhered to versus those engulfed by PMNs (subsets of the C. albicans yeast cells co-sorted with PMNs) and represent a measure of the relative ability of PMNs to phagocytose the C. albicans yeast cells. The open bars represent the proportion of associated cells that had been phagocytosed at this time point. Plotted values are the mean ± standard error of triplicate experi ments using PMNs from six independent donors. Statistical significance was carried out by a student's t-test (vs the value for the control strain in each case): **P < 0.05.
Fig 4. Glycosylation status of the C. albicans cell wall is important for phagocytosis by neutrophils. FITC-labeled C. albicans cells (3 × 10⁶) were incubated with purified anti-CD13-PE-Cy5 labeled neutrophils (1 × 10⁶) at 37°C for 30 minutes in RPMI medium supplemented with 10% donor's plasma. Cells were fixed with 1% paraformaldehyde and 40mM EDTA and 10 μg/ml Calcofluor White added 1 minute prior to microscopy. (A) CAI4 + CIp10, (B) Serotype B, (C) (i) Δmnn4 (ii) Δmnn4 (i) +MNN4, (D) (i) Δoch1 (ii) Δoch1 + OCH1. Note in (D) (i) that the FITC-stained yeast cells have a blue Calcofluor White-stained halo indicating they are on the PMN surface, while in (D) (ii) the FITC-stained cells are phagocytosed and do not stain with Calcofluor White. Scale bar represents 10 μm.
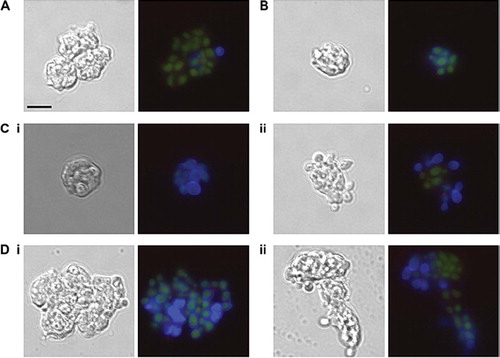
Fig 5. C. albicans killing assay. Bars show the percentage of the tested C. albicans killed following 150 min co-incubation with PMNs at 37°C. Following incubation, PMNs were lysed by hypotonic shock. The remaining C. albicans were washed and stained with 4 μg/ml propidium iodide to stain exposed nucleic acid in dead and terminally damaged cells. A minimum of 100 cells of each strain were counted and the percentage of dead (PI+) cells calculated. Plotted values are the mean ± standard error of six experiments with independent donors, in which each combination was tested in triplicate. Statistical significance was carried out by a student's t-test (vs the value for the control strain in each case): **P < 0.05.
Fig 6. Myeloperoxidase and IL-8 quantification in C. albicans-PMN supernatants. The plot shows MPO and IL-8 production in cell culture supernatant following the co-incubation of PMNs (106 cells) with C. albicans strains (3 × 10⁶ cells) for 30 min at 37°C. MPO and IL-8 concentrations were determined by ELISA assay kits. Controls were cell culture supernatant (RPMI only), pre-incubation supernatant (T = 0 control), and cell culture medium from samples lacking either PMNs (C. albicans only) or C. albicans cells (PMNs only). Plotted values are the mean ± standard error of six experiments with independent donors, in which each combination was tested in triplicate.