Figures & data

Fig. 1 Comparison of the effects of specific stressors upon Candida albicans and Candida glabrata cells grown in YPDT at 30°C. (A) Impact of 2 M sorbitol and 1 M NaCl upon the dynamics of Hog1 phosphorylation in C. glabrata: upper panels, Western blots probed with a phospho-specific antibody against Hog1; lower panels, Western blots probed with an anti-Hog1 antibody that detects total Hog1 (loading control). (B) Impact of 4 h exposure to 5 mM H2O2 and 0.25 mM tBOOH upon C. albicans killing as quantified by propidium iodide staining and FACS analysis. (C) Dynamics of Hog1 phosphorylation in C. albicans following exposure to 0.25 mM tBOOH as assayed by Western blotting. (D) Dynamics of Hog1 phosphorylation in C. albicans following exposure to 5 mM H2O2.
Table 1 Stress doses for Candida albicans and Candida glabrata.
Fig. 2 Dose-dependent killing of Candida albicans and Candida glabrata cells grown in YPDT at 30°C by osmotic and oxidative stresses. Killing was quantified by propidium iodide staining and FACS analysis: blue bars, cell death after 1 h dose of stress; red bars, cell death after 4 h dose of stress. (A) Impact of low, medium and high doses of NaCl upon C. albicans viability. (B) Effects of H2O2 upon C. albicans viability. (C) Influence of NaCl upon C. glabrata viability. (D) Impact of H2O2 upon C. glabrata viability. Values were compared to the no stress controls and significant increases highlighted: *P ≤ 0.05; **P ≤ 0.01; ***P ≤ 0.001.
Fig. 3 Dose-dependent effects of osmotic, oxidative and nitrosative stresses upon the growth of Candida albicans in YPDT at 30°C. The lengths of the lag phase and the doubling time were determined mathematically from growth curves as described in Materials and Methods. (A) Effects of NaCl upon growth. (B) Effects of NaCl upon the length of the lag phase and the doubling time. (C) Effects of H2O2 upon growth. (D) Effects of H2O2 upon the length of the lag phase and the doubling time. (E) Effects of DPTA-NONOate upon growth. (F) Effects of DPTA-NONOate upon the length of the lag phase and the doubling time. Values were compared to the no stress controls and significant increases highlighted: *P ≤ 0.05; **P ≤ 0.01; ***P ≤ 0.001. This Figure is reproduced in color in the online version of Medical Mycology.
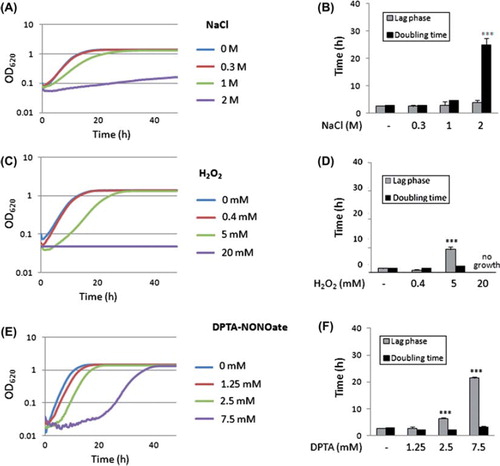
Fig. 4 Effects of medium doses of combinatorial stresses upon the growth of cells in YPDT at 30°C: (A) (B) and (C) C. glabrata; (D) (E) and (F) C. albicans strain NGY152; (G) (H) and (I) C. albicans isolate SC5314. The lengths of the lag phase and the doubling time were determined mathematically from growth curves as described in Materials and methods: gray bars, length of the lag phase; black bars, doubling time. (A) (D) and (G) Comparison of individual and combinatorial osmotic and oxidative stresses. (B) (E) and (H) Comparison of individual and combinatorial osmotic and nitrosative stresses. (C) (F) and (I) Comparison of individual and combinatorial oxidative and nitrosative stresses. Values were compared to the no stress controls and significant increases highlighted: *P ≤ 0.05; **P ≤ 0.01; ***P ≤ 0.001.