Figures & data
Table 1. Characteristics of the population, females aged 70–74 (n = 315).
Table 2. Chronic conditions of the population (n = 315).
Figure 1. Number of chronic conditions in relation with SRH in women aged 70–74 (n = 315). P < 0.001.
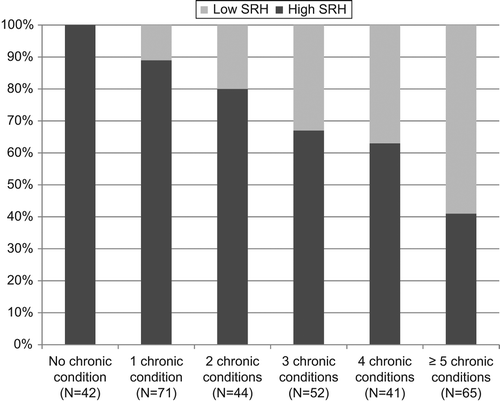
Table 3. Top five chronic conditions and the most prevalent combinations and combinations present in more than 20 women.