
Figures & data
Table 1. Comparison of the characteristics of regular GP's and their lists according to immigrant or native background.
Table 2. Characteristic of the immigrant regular GPs working in Norway and their lists in 2008 according to their geographical background.
Figure 1. Mean percentage of patients with different immigrant background according to the regular GP's immigrant background (All patients with any immigrant background included).
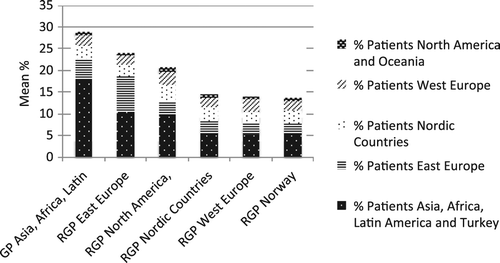
Table 3. Characteristics of the lists and patients in the lists for immigrant regular GPs compared to native Norwegians. Binary logistic regression. OR and 95% CI.
Table 4. Impact of time living in Norway among immigrant regular GPs (n = 728). Binary logistic regression, OR and 95% CI comparing number of years living in Norway over or under the median (12 years).