Figures & data
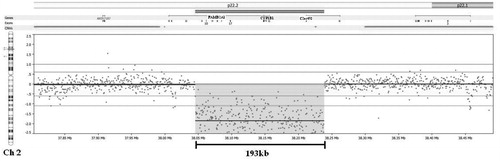
Figure 1. Homozygous deletion and breakpoints in chromosome 2, encompassing the entire CYP1B1 gene, including exons 1–2 of the C2orf58 (chromosome 2 open reading frame 58, MGC34824) gene, and exons 3–11 of the FAM82A1 (Family with sequence similarity 82, member A1). CNV regions are indicated by the pink bars. The double red bars indicate the area of the 193 kb deletion. Exons of the genes involved are indicated by marks below each gene name. Probes are indicated by dots. The median probe spacing for this array is 575 bp. The area of the deletion is indicated by the pink highlighted area encompassing the probes which occur on the scale below the normal variation, indicative of a homozygous deletion.