Figures & data
FIGURE 1. Pedigree of the family and segregation of the MMACHC mutations with the disease phenotype. The open circle and squares represent the unaffected female and male family members, respectively; the closed circle represents the affected female patient.
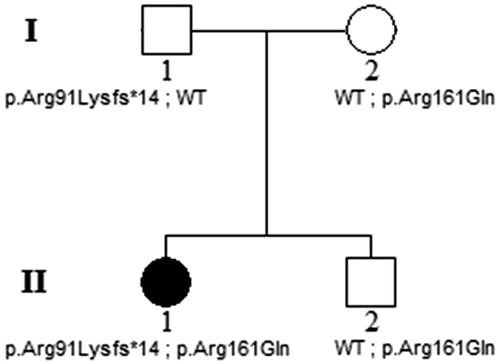
FIGURE 2. Goldmann visual fields of the left (A) and right (B) eyes from the initial visit in 2006, showing ring scotomas consistent with the bull’s eye-appearing macular lesions. Shaded areas indicate the target was not seen in that area. Fundus photos from 2006 (C, right eye and D, left eye) and 2013 (E and F) show some extension of RPE atrophy, apparent at the peripheral boundaries, as well as in the foveal region, in both eyes over 7 years. Near-infrared autofluorescence (G and H) from the 2013 follow-up visit shows hyper-autofluorescence at the fovea, surrounded by hypo-autofluorescence (bull’s eye), further surrounded by a ring of hyper-autofluorescence.
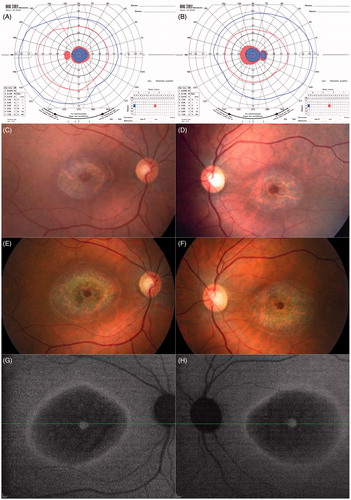
FIGURE 3. Spectral domain optical coherence tomography line scans (right eye top and left eye bottom, corresponding to the location of the horizontal lines on the near-infrared autofluorescence images in , respectively) show intact RPE at the foveola in the presence of marked foveal thinning, surrounded by atrophy of the outer retinal layers and retinal pigment epithelium, with relatively more normal retinal structure at the margins of the line scans in both eyes.
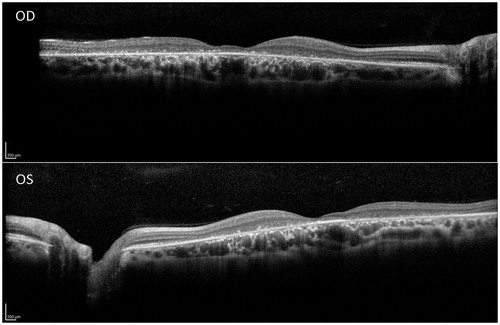
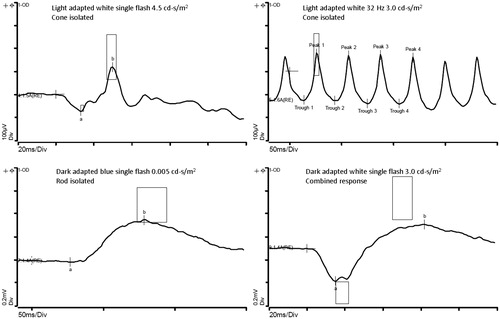
FIGURE 4. Full-field electroretinogram (Espion E3, Diagnosys LLC, Littleton, MA) of the patient’s right eye at age 35 during a follow-up visit. Boxes represent ranges of 13 visually-normal subjects. The cone isolated amplitudes and implicit times (top), and the rod isolated single flash response (bottom left) are within the normal range. The combined rod and cone single flash response (bottom right) is mildly reduced and delayed compared to normal.