2,043
Views
6
CrossRef citations to date
0
Altmetric
Research Article

The protective effect of Tinospora cordifolia on various mast cell mediated allergic reactions

, , &
Pages 1096-1106 | Received 04 Jun 2008, Accepted 08 Sep 2008, Published online: 19 Oct 2009

Figures & data

Table 1. The effect of TC (125- 1000 mg/kg, p.o.) treatment on compound 48/80 induced lethality in rats.

Table 2. The effect of TC (125- 1000 mg/kg, p.o.) treatment on histamine induced paw edema in mice.

Table 3. The effect of TC (125- 1000 mg/kg, p.o.) treatment on anti-DNP IgE induced cutaneous reaction (vascular permeability of Evans blue) in rats.

Table 4. The effect of TC (125-1000 mg/kg, p.o.) treatment on compound 48/80 induced ear swelling response in mice.

Table 5. The effect of TC (125-1000 mg/kg, p.o.) or cetirizine (0.3 mg/kg) alone on allergic bronchoconstriction in guinea pigs.

Table 6. The effect of TC (2.5-160 μg/mL) treatment on histamine induced contraction of guinea pig ileum in vitro.

Figure 1. Effect of TC on dose-response curves for histamine- induced contraction of guinea pig ileum. Dose-response curves for histamine-induced contraction of guinea pig ileum were obtained in the absence of (•) or presence of 2.5 (▪), 5 (▴), 10 (□) and 20 (▾) mg/mL TC. Each point is the mean percentage of response (n = 4-5) at a given concentration of histamine with respect to the maximum contraction obtained in the control curve (•). pA2 = 7.5.
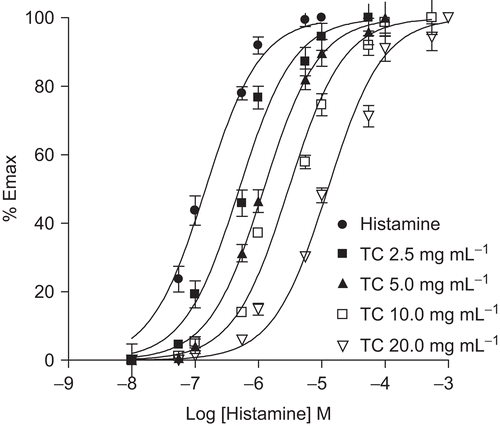
Figure 1.  Effect of TC on dose-response curves for histamine- induced contraction of guinea pig ileum. Dose-response curves for histamine-induced contraction of guinea pig ileum were obtained in the absence of (•) or presence of 2.5 (▪), 5 (▴), 10 (□) and 20 (▾) mg/mL TC. Each point is the mean percentage of response (n = 4-5) at a given concentration of histamine with respect to the maximum contraction obtained in the control curve (•). pA2 = 7.5.

Figure 2. The effect of TC (0.01-10 mg/mL) and sodium chromoglycate (SC) treatment on compound 48/80-induced histamine release from mast cells. RPMC (2 × 105 cells/mL) were preincubated with test samples at 37°C for 10 min prior to incubation with compound 48/80. Each data represents the mean ± SEM of 3 independent experiments. ***p < 0.001; **p < 0.01; *p < 0.05; n.s., not significant compared to saline value.
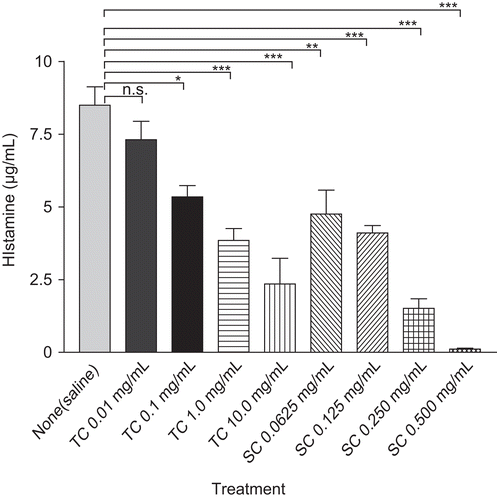
Figure 2.  The effect of TC (0.01-10 mg/mL) and sodium chromoglycate (SC) treatment on compound 48/80-induced histamine release from mast cells. RPMC (2 × 105 cells/mL) were preincubated with test samples at 37°C for 10 min prior to incubation with compound 48/80. Each data represents the mean ± SEM of 3 independent experiments. ***p < 0.001; **p < 0.01; *p < 0.05; n.s., not significant compared to saline value.

Figure 3. The effect of TC (0.01-10 mg/mL) and cetirizine (Cet.) treatment on anti-DNP IgE antibody-induced TNF-α secretion from mast cells (MC). RPMC (3 × 105 cells/mL) were sensitized with anti-DNP IgE (1 mg/mL) and incubated for 18 h in the absence or presence of test samples before the challenge with DNP-HSA (0.1 mg/mL). Each data represents the mean ± SEM of 3 independent experiments. ***p < 0.001; **p < 0.01; *p < 0.05; n.s., not significant compared to mast cell+ anti-DNP IgE+DNP-HSA group.
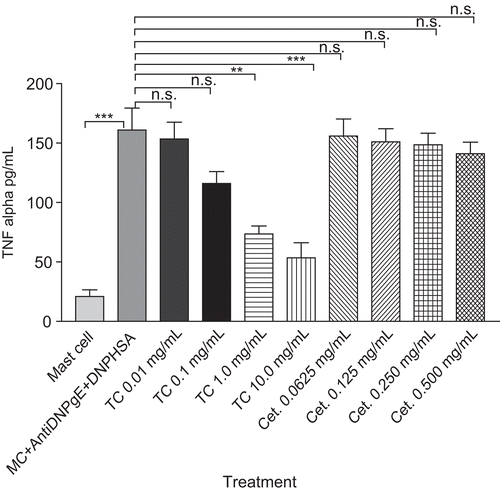
Figure 3.  The effect of TC (0.01-10 mg/mL) and cetirizine (Cet.) treatment on anti-DNP IgE antibody-induced TNF-α secretion from mast cells (MC). RPMC (3 × 105 cells/mL) were sensitized with anti-DNP IgE (1 mg/mL) and incubated for 18 h in the absence or presence of test samples before the challenge with DNP-HSA (0.1 mg/mL). Each data represents the mean ± SEM of 3 independent experiments. ***p < 0.001; **p < 0.01; *p < 0.05; n.s., not significant compared to mast cell+ anti-DNP IgE+DNP-HSA group.

Figure 4. Time-dependent effect of TC (1 mg/mL) on cAMP level of RPMC. RPMC (2 × 105 cells/mL) were preincubated with test samples at 37°C for 10 min prior to incubation with compound 48/80 (5 mg/mL). Each datum represents the mean ± SEM of three independent experiments. ***p < 0.001; **p < 0.01; *p < 0.05; n.s., not significant compared to saline value.
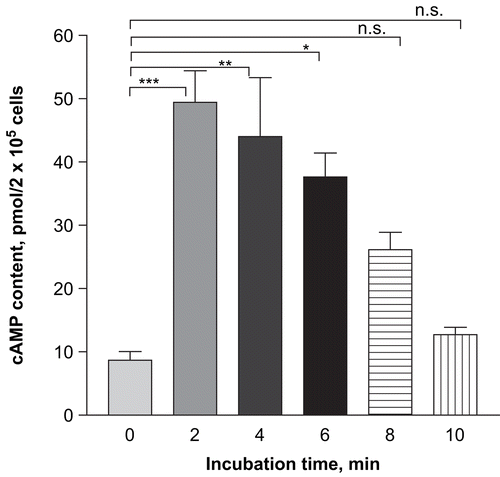
Figure 4.  Time-dependent effect of TC (1 mg/mL) on cAMP level of RPMC. RPMC (2 × 105 cells/mL) were preincubated with test samples at 37°C for 10 min prior to incubation with compound 48/80 (5 mg/mL). Each datum represents the mean ± SEM of three independent experiments. ***p < 0.001; **p < 0.01; *p < 0.05; n.s., not significant compared to saline value.

Figure 5. Effect of TC on the intracellular Ca2+ levels in RPMC. RPMC (2 × 105 cells/mL) were preincubated with test samples at 37°C for 10 min before adding compound 48/80 (5 mg/mL) and then another 10 min with compound 48/80. Each data represents the mean ± SEM of 3 independent experiments. ***p < 0.001; **p < 0.01; *p < 0.05; n.s., not significant for the compound 48/80 value.
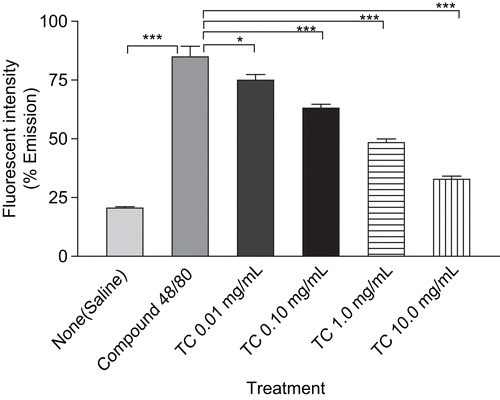
Figure 5.  Effect of TC on the intracellular Ca2+ levels in RPMC. RPMC (2 × 105 cells/mL) were preincubated with test samples at 37°C for 10 min before adding compound 48/80 (5 mg/mL) and then another 10 min with compound 48/80. Each data represents the mean ± SEM of 3 independent experiments. ***p < 0.001; **p < 0.01; *p < 0.05; n.s., not significant for the compound 48/80 value.

Figure 6. Effect of TC on concentration-response relationships for intracellular reactive oxygen species. Concentration-response relationships for intracellular reactive oxygen species generation in the absence and presence of TC (0.01- 10 mg/mL) from rat peritoneal mast cells (2 × 105 cells/mL) in response to compound 48/80. Each point is the mean ± SEM of six experiments. ***p < 0.001; **p < 0.01; *p < 0.05; n.s., not significant compared to saline value.
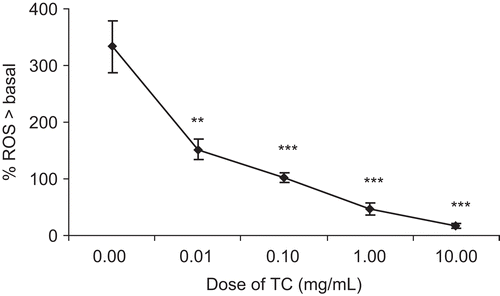
Figure 6.  Effect of TC on concentration-response relationships for intracellular reactive oxygen species. Concentration-response relationships for intracellular reactive oxygen species generation in the absence and presence of TC (0.01- 10 mg/mL) from rat peritoneal mast cells (2 × 105 cells/mL) in response to compound 48/80. Each point is the mean ± SEM of six experiments. ***p < 0.001; **p < 0.01; *p < 0.05; n.s., not significant compared to saline value.

Reprints and Corporate Permissions

Please note: Selecting permissions does not provide access to the full text of the article, please see our help page How do I view content?

To request a reprint or corporate permissions for this article, please click on the relevant link below:

Academic Permissions

Please note: Selecting permissions does not provide access to the full text of the article, please see our help page How do I view content?

Obtain permissions instantly via Rightslink by clicking on the button below:

If you are unable to obtain permissions via Rightslink, please complete and submit this Permissions form. For more information, please visit our Permissions help page.