2,265
Views
24
CrossRef citations to date
0
Altmetric
Research Article

Comparative analysis of cytotoxic effect of aqueous cinnamon extract from Cinnamomum zeylanicum bark with commercial cinnamaldehyde on various cell lines

, , , , &
Pages 1174-1179 | Received 12 Jul 2008, Accepted 18 Sep 2008, Published online: 02 Nov 2009

Figures & data

Figure 1. HPTLC chromatograms of (A) standard mixture of piperine, cinnamaldehyde and eugenol; (B) aqueous cinnamon extract (ACE). The amount of cinnamaldehyde present in ACE was determined from the calibration curve obtained by plotting the concentration of standard against the peak area of test sample (ACE). The quantity of cinnamaldehyde in ACE was found to be around 0.25% w/v. Thus, 50 mg/mL stock solution of ACE contained 400 μM cinnamaldehyde content. (B) Calibration curve for quantification of analytes from ACE.
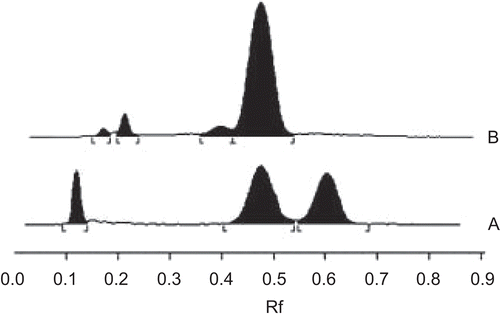
Figure 1.  HPTLC chromatograms of (A) standard mixture of piperine, cinnamaldehyde and eugenol; (B) aqueous cinnamon extract (ACE). The amount of cinnamaldehyde present in ACE was determined from the calibration curve obtained by plotting the concentration of standard against the peak area of test sample (ACE). The quantity of cinnamaldehyde in ACE was found to be around 0.25% w/v. Thus, 50 mg/mL stock solution of ACE contained 400 μM cinnamaldehyde content. (B) Calibration curve for quantification of analytes from ACE.

Figure 2. The amount of polyphenols present in ACE was determined from the calibration curve obtained by plotting the concentration of standard gallic acid equivalent against the test sample (ACE). The typical regression equation was y = 0.0056 x+ 0.2011 for polyphenols. The quantity of polyphenols in 50 mg/mL ACE was found to be 380.83 μg/mL or 0.76%. Standard plot obtained by plotting the concentration of gallic acid equivalent.
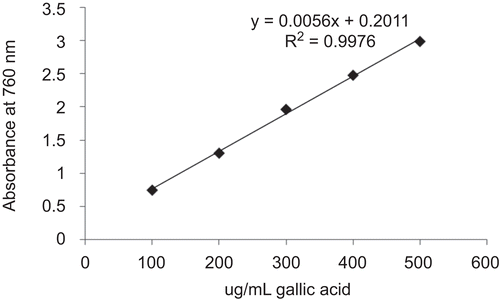
Figure 2.  The amount of polyphenols present in ACE was determined from the calibration curve obtained by plotting the concentration of standard gallic acid equivalent against the test sample (ACE). The typical regression equation was y = 0.0056 x+ 0.2011 for polyphenols. The quantity of polyphenols in 50 mg/mL ACE was found to be 380.83 μg/mL or 0.76%. Standard plot obtained by plotting the concentration of gallic acid equivalent.

Table 1. Effect of different concentrations of aqueous cinnamon extract (ACE) on cell viability.

Table 2. Effect of different concentrations of commercial cinnamaldehyde on cell viability.

Table 3. Comparative analysis of cytotoxicity of ACE with that of commercial cinnamaldehyde.

Reprints and Corporate Permissions

Please note: Selecting permissions does not provide access to the full text of the article, please see our help page How do I view content?

To request a reprint or corporate permissions for this article, please click on the relevant link below:

Academic Permissions

Please note: Selecting permissions does not provide access to the full text of the article, please see our help page How do I view content?

Obtain permissions instantly via Rightslink by clicking on the button below:

If you are unable to obtain permissions via Rightslink, please complete and submit this Permissions form. For more information, please visit our Permissions help page.