Figures & data
Table 1. Specific peaks (in cm−1) in Fourier transform infrared–fingerprint spectra (FTIR–FPS) of herbal medicines for their characterization.
Figure 1. Fourier transform infrared (FTIR) spectra of (a) Arjuna (Terminalia arjuna L.), (b) Aswagandha (Withania somnifera L.), (c) Aawala (Emblic myrobalan Burm.), and (d) Tulsi (Ocimum sanctum L.) from different places showing similarity among them. J, Jaipur; M, Mumbai; V, Varanasi; A, Ahmedabad.
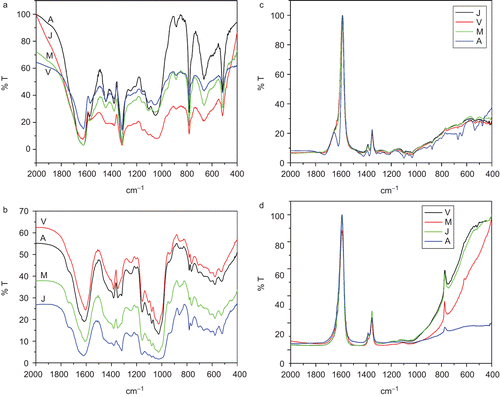
Figure 2. Second derivative Fourier transform infrared (FTIR) spectra of Arjuna (Terminalia arjuna L.) collected from different places.
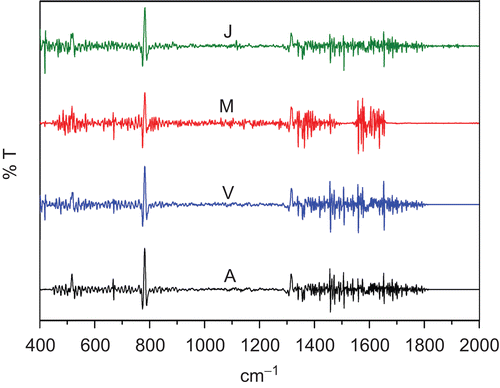
Table 2. Ratios of areas of assigned characteristic peaks.
Figure 3. Graph showing consistent nature of ratio of areas of marked characteristic peaks for herbal samples collected from different places.
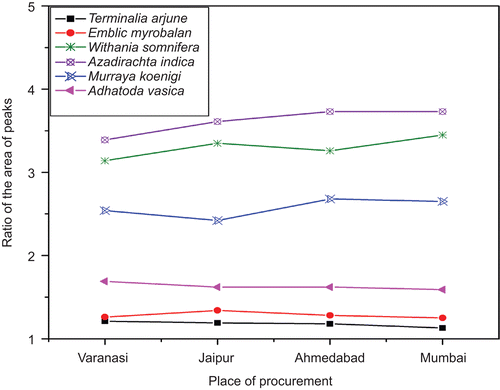
Table 3. Eigen values and percentages of total variance from principal component analysis (PCA) of Fourier transform infrared spectral data for each of first seven principal components.
Figure 4. Principal component (PC) plots showing clustering of herbal medicines into different groups.
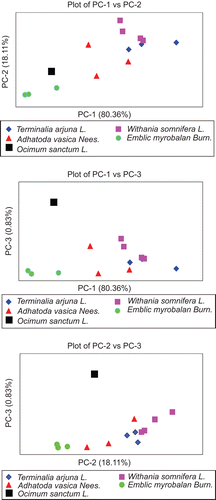
Table 4. Heavy metal concentration (in ppm) in crude herbal/commercial Ayurvedic medicines.
Table 5. Comparison of dose converted concentration of Cd in parts per million (ppm) with the recommended daily intake limit.