Figures & data
Figure 1. RT-PCR analysis of uPA and Ets-1 genes. After SKOV3 cells were cultured in basal medium and different concentrations of bFGF (0.1, 1, 10, 100 ng/mL) for 24 h, a significant change of expression of uPA and Ets-1 mRNA of SKOV3 cells was observed. The increase of both genes presented a dose-dependent response. β-actin was functioning here as a housekeeping gene.
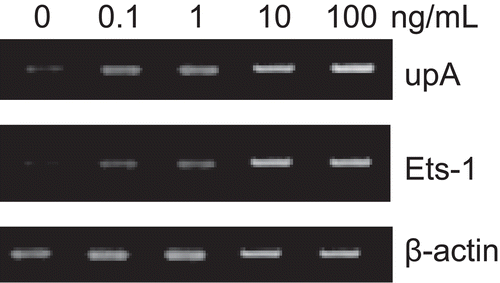
Figure 2. Effect of bFGF on secretion of uPA protein. Each bar represents mean ± SEM. After treatment with different concentrations of bFGF (0.1, 1, 10, 100 ng/mL), supernantant was obtained from cultures of SKOV3 cells, and tested by ELISA. The expression of uPA protein increased due to stimulation with bFGF in a dose-dependent manner.
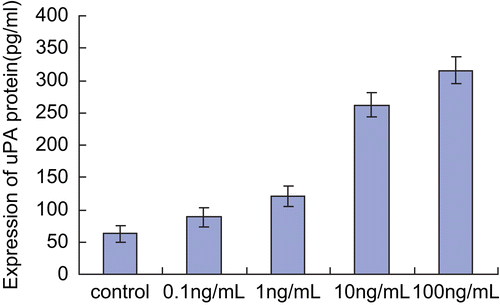
Table 1. Effect of bFGF on cell invasion of SKOV3 cells and the effect of antisense oligonucleotides on that procedure.