Figures & data
Table 1. Effect of FRPE and FRME on serum proteins, urea, creatinine and total bilirubin.
Figure 1. Effect of FRPE and FRME on serum hepatic enzymes.
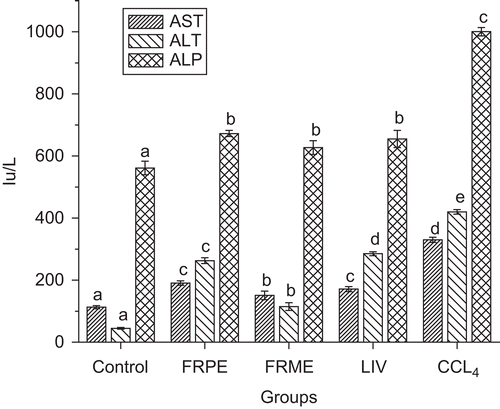
Figure 2. Effect of FRPE and FRME on serum, hepatic, renal TBARS.
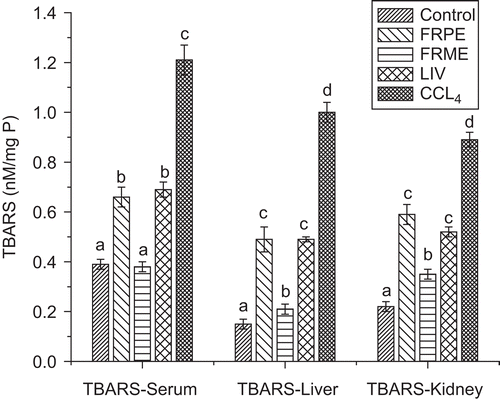
Figure 3. Effect of FRPE and FRME on serum, hepatic, renal GSH.
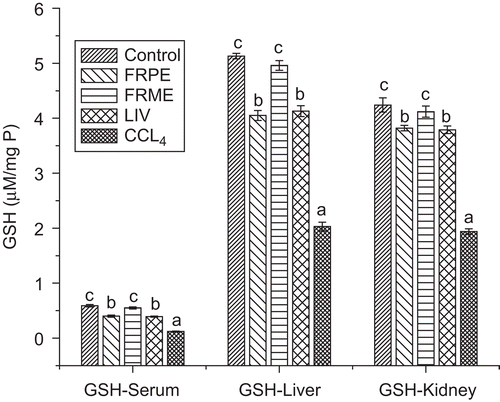
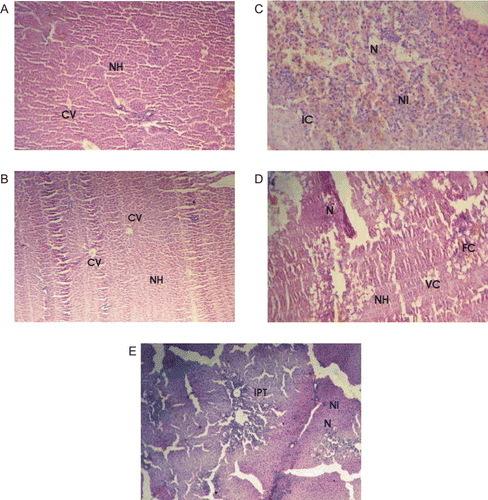
Figure 4. (A) Section of the liver tissue of control rats showing normal hepatocytes and central vein. (C) Section of the liver tissue of rats treated with CCl4 showing severe necrosis, neutrophil infiltrate and inflammatory changes. (D) Section of the liver tissue of FRPE-pretreated rats showing normal hepatocytes necrosis and fatty changes. (B) Section of the liver tissue of FRME-pretreated rats showing normal hepatocytes and central vein. (E) Section of the liver tissue of Liv52-pretreated rats showing inflammatory changes and necrosis. NH, normal hepatocytes; CV, central vein; N, necrosis; NI, neutrophil infiltrate; IC, inflammatory cells; FC, fatty changes; VC, vacuolated cells; IPT, inflammatory infiltrate around the portal triad.