Figures & data
Table 1. L18 (21×37) scheme of the combinatorial orthogonal test.
Table 2. Groups and concentration of matrine.
Figure 1. Matrine changed the morphology of HepG2 and induced part cells to death. HepG2 cell incubated with different concentration of matrine for 4 days were harvested for H&E staining (×400magnification) to view cell morphology under multifunctional microscope. Untreated cells served as control (A), and treated cells were shown in 0.2 mg/mL (B); 1.5 mg/mL (C); 3.0 mg/mL (D) and the green arrow indicated the plasmatorrhexis.
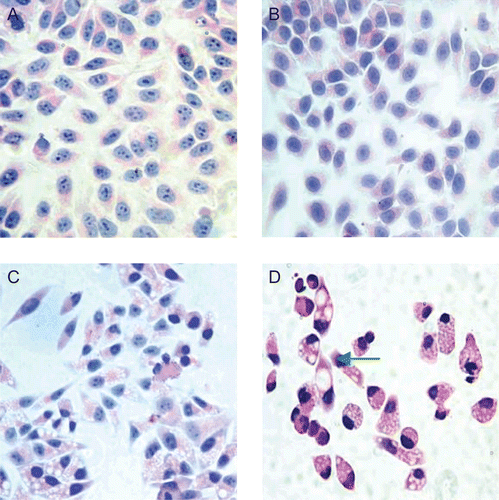
Figure 2. Matrine inhibited the proliferation of HepG2 cells in vitro compared with the control. HepG2 cells were incubated in presence of matrine at different concentrations (from 0.1 to 0.5 mg/mL, and from0.3 to 3.5 mg/mL) for 4 days, and cell proliferation was determined by MTT assay to calculate the proliferation inhibition rate (%). Negative-inhibition effects were found at the concentration of matrine below 0.2 mg/mL as shown in left section, whereas positive dose-dependent inhibition of HepG2 cell growth by matrine as described in right section.
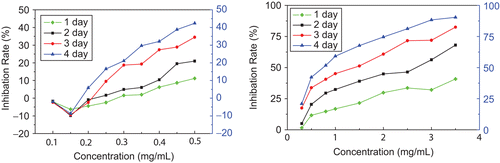
Figure 3. Matrine down-regulated the expression of AFP and PCNA proteins. HepG2 cells incubated with absence (E, G) or presence of 0.8 mg/mL matrine for 2 days were determined with immunohistochemistry analysis. HepG2 cells were viewed under multifunctional microscope (×400magnification). Immunostaining intensity of AFP (F) and PCNA (H) were weaker than control. The decrease demonstrated the down-regulation of protein expression.
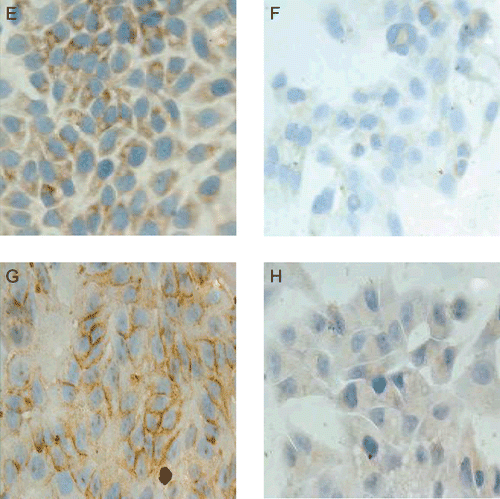
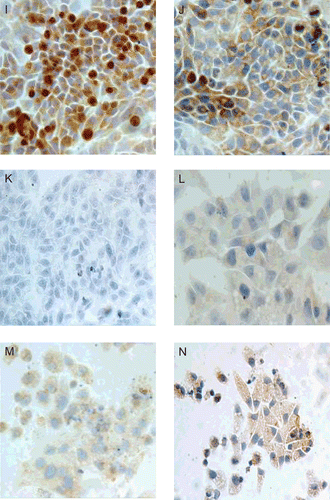
Figure 4. Matrine down-regulated the expression of C-myc, Bcl-2, and up-regulated the expression of Bax. HepG2 cells cultured in DMEM (upper row, I, J, K) or DMEM containing 0.8 mg/mL matrine (lower row, L, M, N) for 2 days were detected with immunostaining. HepG2 cells were viewed under multifunctional microscope (×400magnification). Expression of C-myc (first column) and Bcl-2 (second column) were seen in the cell nucleolus and cytoplasm of matrine-treated cells and the staining intensity was weaker than that of untreated cells. Bax (third column) expressed stronger than untreated cells. The mean grade of staining intensity was higher compared with control cells.