Figures & data
Table 1. Oligonucleotide primers and probes.
Figure 1. Weight variation of the animals during the experiment as a function of time (mean ± SD). Distinct letters show statistical difference between treatments within the same period or between the same treatment along the whole experiment (p <0.05).
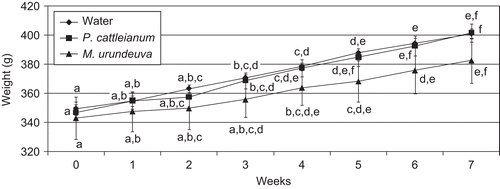
Figure 2. Streptococcus mutans counts from oral biofilm of rats from different experimental groups in time (mean ± SD, n = 10). Distinct letters show statistical difference between treatments within the same period or between the same treatment along the whole experiment (p <0.05).
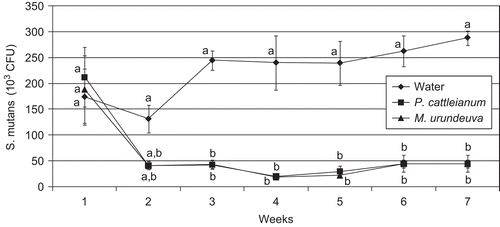
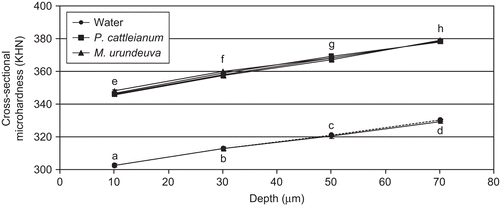
Figure 3. Cross-sectional micro-hardness (in KHN) from incisors (solid lines) or molars (dashed lines) as a function of depth after exposure to water or the extracts for 7 weeks (mean ± se, n = 10). Distinct letters show statistical difference between treatment groups and depth (ANOVA, p<0.05).