Figures & data
Figure 1. Chemical structure of griffonianone C.
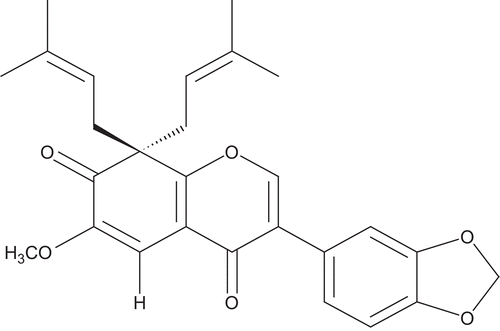
Table 1. Primers sequences for real-time PCR
Figure 2. Cyclin D1 (A), Ki-67 (B), proliferating cell nuclear antigen (C) mRNA expression in MCF-7 cells treated with vehicle (DSMO, control), estradiol (10−8 M), and griffonianone C for 24 h. Expression of mRNA was analyzed by semiquantitative real-time PCR. Data represent means ± SEM. Asterisk indicates a significant difference as compared to the vehicle-treated cells. *p < 0.05, **p < 0.005 (analysis of variance followed by a post hoc multiple comparison). CD1 and Ki-67 were upregulated after griffonianone treatment in MCF-7 cells. PCNA was slightly upregulated.
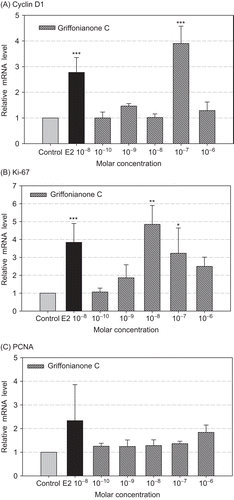
Figure 3. Western blot analyses of Akt and phospho-Akt in MCF-7 cells in culture. Effect of 17β-estradiol on Akt and phosphorylated Akt expression. (A) Immunoblot of MCF-7 cells treated by E2 for 15 min before harvesting cells for lysis. Lane 1: 10−10 M E2; lane 2: 10−9 M E2; lane 3: 10−8 M E2; lane 4: 10−7 M E2; lane 5: 10−6 M E2. The cells treated with ethanol or dimethyl sulfoxide were included as the control. (B) The signals of Akt phosphorylation were quantitated using the NIH image analysis program (1.43 ImageJ), and the relative intensity of sample bands is shown in the bar diagram. Phosphorylated Akt in the control is set as 1. Experiments were repeated four times with similar results, and representative blots are presented.
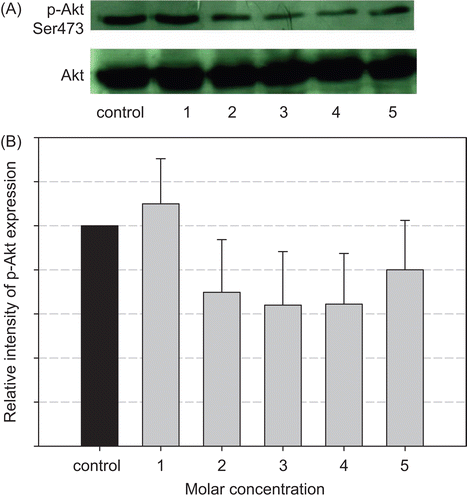
Figure 4. Western blot analyses of Akt and phospho-Akt in MCF-7 cells in culture. Effect of Griff C on Akt and phosphorylated Akt expression. (A) Immunoblot of MCF-7 cells treated by Griff C for 15 min before harvesting cells for lysis. Lane 1: 10−10 M Griff C; lane 2: 10−9 M Griff C; lane 3: 10−8 M Griff C; lane 4: 10−7 M Griff C; lane 5: 10−6 M Griff C. The cells treated with ethanol or dimethyl sulfoxide were included as the control. (B) The signals of Akt phosphorylation were quantitated using the NIH image analysis program (1.43 ImageJ), and the relative intensity of sample bands is shown in the bar diagram. Phosphorylated Akt in the control is set as 1. Experiments were repeated four times with similar results, and representative blots are presented. *p < 0.005; **p < 0.0005; ***p < 0.0001 (analysis of variance followed by a post hoc multiple comparison).
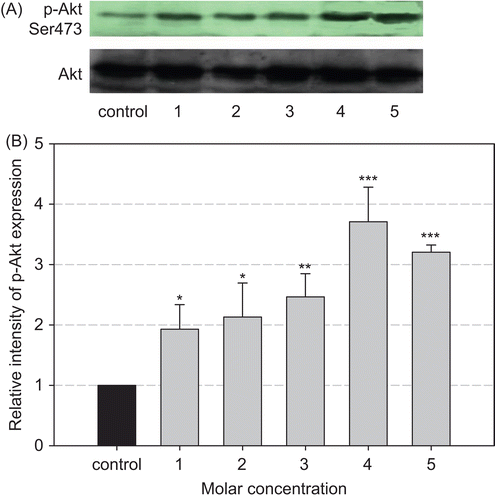
Figure 5. Regulation of Akt phosphorylation by PI3K inhibitor LY294002. (A) Immunoblot of MCF-7 treated with vehicle (ethanol) or LY294002 for 15 min before harvesting cells for lysis. C: control; LY25: 25 mM LY294002; LY50: 50 mM LY294002. The cells treated with ethanol or dimethyl sulfoxide were included as the control. (B) The signals of Akt phosphorylation were quantitated using the NIH image analysis program (1.43 ImageJ), and the relative intensity of sample bands is shown in the bar diagram. Phosphorylated Akt in the control is set as 1. Experiments were repeated four times with similar results, and representative blots are presented. *p < 0.005 (analysis of variance followed by a post hoc multiple comparison).
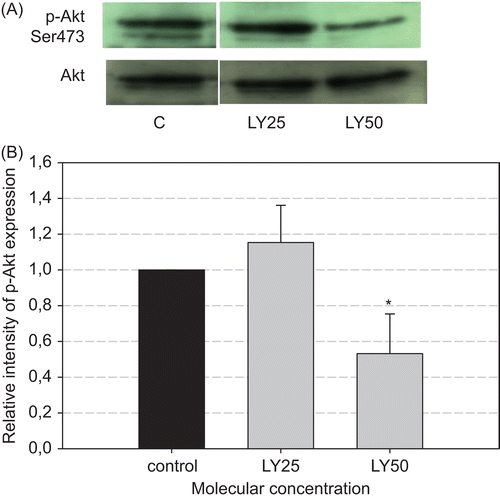
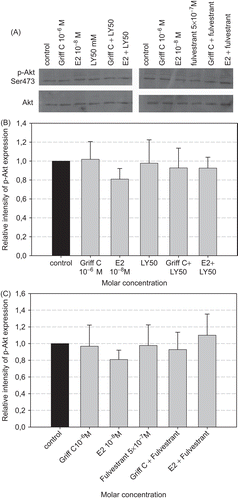
Figure 6. (A) Effects of PI3K inhibitor LY294002 and estrogen receptor antagonist fulvestrant on the phosphorylation of Akt induced by 17β-estradiol and Griff C. MCF-7 breast cancer cells were treated with Griff C (10−6 M), E2 (10−8 M), LY294002 (50 mM), fulvestrant (5 × 10⁻⁷ M), or both Griff C and LY50, or E2 and LY50, or Griff C and fulvestrant, or E2 and fulvestrant for 15 min. The cells treated with ethanol or dimethyl sulfoxide were included as the control. (B, C) The signals of Akt phosphorylation were quantitated using the NIH image analysis program (1.43 ImageJ), and the relative intensity of sample bands is shown in the bar diagram. Phosphorylated Akt in the control is set as 1. Experiments were repeated four times with similar results, and representative blots are presented.