500
Views
1
CrossRef citations to date
0
Altmetric
Research Article

Preliminary screening for extraction techniques and bioactive fraction of Coptidis Rhizoma based on microcalorimetry

, , &
Pages 362-368 | Received 16 May 2010, Accepted 17 Aug 2010, Published online: 24 Mar 2011

Figures & data

Figure 1.  The power–time curve of E. coli growth at 37°C without any substance. E. coli was cultured in LB culture medium and monitored using a TAM air isothermal calorimeter, ampoule method at 37°C.
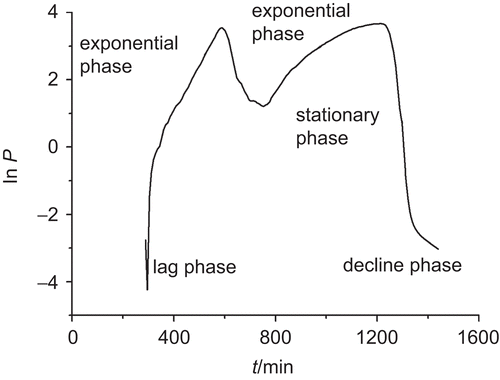
Figure 1.  The power–time curve of E. coli growth at 37°C without any substance. E. coli was cultured in LB culture medium and monitored using a TAM air isothermal calorimeter, ampoule method at 37°C.

Table 1.  Growth rate constants k1 and k2 of E. coli growth at 37°C.

Table 2.  The thermokinetic parameters of E. coli growth at 37°C affected by C. Rhizoma extractions at 2 mg/mL.

Figure 2.  The power–time curves of E. coli growth at 37°C affected by C. Rhizoma fractions obtained from (A) decoction, (B) refluxing, and (C) ultrasound techniques. The various factions were (a) control, (b) water extraction, (c) residue, (d) PE fraction, (e) CHCl3 fraction, (f) EtOAc fraction, and (g) n-BuOH fraction with the final concentration of 2.00 mg/mL in the LB culture medium.
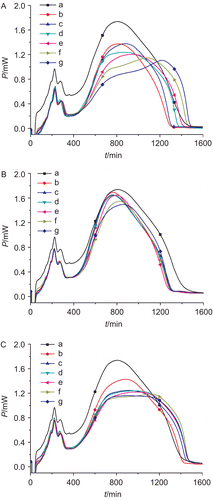
Figure 2.  The power–time curves of E. coli growth at 37°C affected by C. Rhizoma fractions obtained from (A) decoction, (B) refluxing, and (C) ultrasound techniques. The various factions were (a) control, (b) water extraction, (c) residue, (d) PE fraction, (e) CHCl3 fraction, (f) EtOAc fraction, and (g) n-BuOH fraction with the final concentration of 2.00 mg/mL in the LB culture medium.

Table 3.  ANOVA results for three extraction groups.

Table 4.  The thermokinetic parameters of E. coli growth at 37°C affected by n-BuOH fraction of C. Rhizoma.
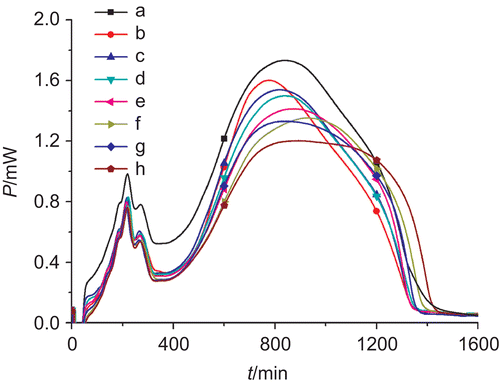
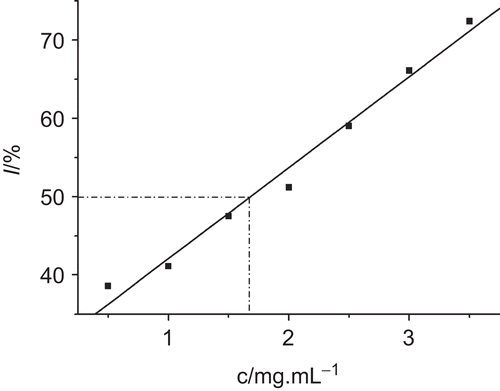
Figure 3.  The power–time curves of E. coli growth at 37°C affected by n-BuOH fractions of C. Rhizoma got obtained by decoction techniques at concentrations of (a) 0, (b) 0.5, (c) 1.0, (d) 1.5, (e) 2.0, (f) 2.5, (g) 3.0, and (h) 3.5 mg/mL.

Figure 3.  The power–time curves of E. coli growth at 37°C affected by n-BuOH fractions of C. Rhizoma got obtained by decoction techniques at concentrations of (a) 0, (b) 0.5, (c) 1.0, (d) 1.5, (e) 2.0, (f) 2.5, (g) 3.0, and (h) 3.5 mg/mL.

Figure 4.  Relationship between inhibition ratio (I) and c. The linear relationship between I and c was good with R of 0.9940. IC50 (1.68 mg/mL) was calculated from this linear relationship.

Figure 4.  Relationship between inhibition ratio (I) and c. The linear relationship between I and c was good with R of 0.9940. IC50 (1.68 mg/mL) was calculated from this linear relationship.

Reprints and Corporate Permissions

Please note: Selecting permissions does not provide access to the full text of the article, please see our help page How do I view content?

To request a reprint or corporate permissions for this article, please click on the relevant link below:

Academic Permissions

Please note: Selecting permissions does not provide access to the full text of the article, please see our help page How do I view content?

Obtain permissions instantly via Rightslink by clicking on the button below:

If you are unable to obtain permissions via Rightslink, please complete and submit this Permissions form. For more information, please visit our Permissions help page.