1,286
Views
11
CrossRef citations to date
0
Altmetric
Research Article

Protective effect of Woodfordia fruticosa flowers against acetaminophen-induced hepatic toxicity in rats

&
Pages 826-832 | Received 28 Oct 2010, Accepted 18 Dec 2010, Published online: 18 Apr 2011

Figures & data

Figure 1.  Effect of Woodfordia fruticosa methanol (WFM) on different biochemical parameters in acetaminophen (APAP)-induced hepatic damage in rats. Group I: Normal control, Group II: Toxin control APAP, Group III: WFM-400 mg/kg + APAP, Group IV: WFM-600 mg/kg + APAP, Group V: Silymarin-100 mg/kg + APAP. Results are expressed as mean ± SEM, (n = 6). #P < 0.05, ##P < 0.01, ###P < 0.001 as compared with normal control group; *P < 0.05, **P < 0.01, ***P < 0.01 as compared with toxin control group.
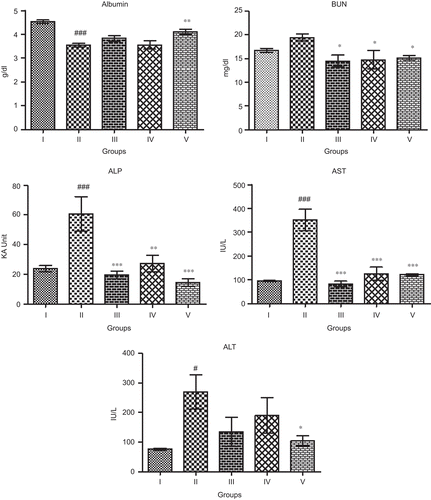
Figure 1.  Effect of Woodfordia fruticosa methanol (WFM) on different biochemical parameters in acetaminophen (APAP)-induced hepatic damage in rats. Group I: Normal control, Group II: Toxin control APAP, Group III: WFM-400 mg/kg + APAP, Group IV: WFM-600 mg/kg + APAP, Group V: Silymarin-100 mg/kg + APAP. Results are expressed as mean ± SEM, (n = 6). #P < 0.05, ##P < 0.01, ###P < 0.001 as compared with normal control group; *P < 0.05, **P < 0.01, ***P < 0.01 as compared with toxin control group.
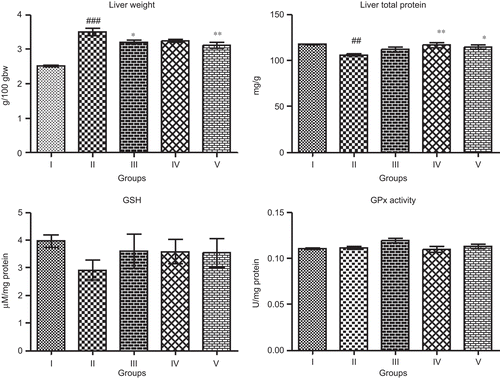
Figure 2.  Effect of WFM on relative liver weight and different liver non-enzymatic and enzymatic antioxidants in APAP-induced hepatic damage in rats. Group I: Normal control, Group II: Toxin control APAP, Group III: WFM-400 mg/kg + APAP, Group IV: WFM-600 mg/kg + APAP, Group V: Silymarin-100 mg/kg + APAP. Results are expressed as mean ± SEM, (n = 6). #P < 0.05, ##P < 0.01, ###P < 0.001 as compared with normal control group; *P < 0.05, **P < 0.01, ***P < 0.01 as compared with toxin control group.
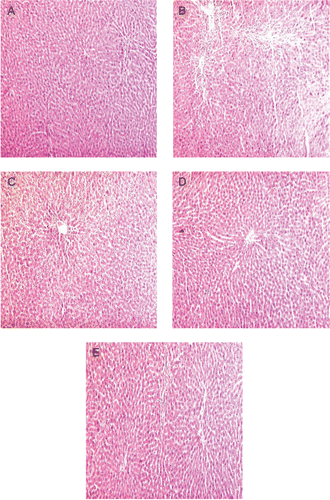
Figure 2.  Effect of WFM on relative liver weight and different liver non-enzymatic and enzymatic antioxidants in APAP-induced hepatic damage in rats. Group I: Normal control, Group II: Toxin control APAP, Group III: WFM-400 mg/kg + APAP, Group IV: WFM-600 mg/kg + APAP, Group V: Silymarin-100 mg/kg + APAP. Results are expressed as mean ± SEM, (n = 6). #P < 0.05, ##P < 0.01, ###P < 0.001 as compared with normal control group; *P < 0.05, **P < 0.01, ***P < 0.01 as compared with toxin control group.

Figure 3.  Photographs of liver sections of APAP-treated rats (hematoxylin and eosin stained, 10x). (A) Normal control, (B) Toxin control (APAP), (C) WFM-400 + APAP, (D) WFM-600 + APAP, (E) Silymarin-100 + APAP.

Figure 3.  Photographs of liver sections of APAP-treated rats (hematoxylin and eosin stained, 10x). (A) Normal control, (B) Toxin control (APAP), (C) WFM-400 + APAP, (D) WFM-600 + APAP, (E) Silymarin-100 + APAP.

Reprints and Corporate Permissions

Please note: Selecting permissions does not provide access to the full text of the article, please see our help page How do I view content?

To request a reprint or corporate permissions for this article, please click on the relevant link below:

Academic Permissions

Please note: Selecting permissions does not provide access to the full text of the article, please see our help page How do I view content?

Obtain permissions instantly via Rightslink by clicking on the button below:

If you are unable to obtain permissions via Rightslink, please complete and submit this Permissions form. For more information, please visit our Permissions help page.