850
Views
15
CrossRef citations to date
0
Altmetric
Research Article

Protective effects of Carthamus tinctorius injection on isoprenaline-induced myocardial injury in rats

, , , &
Pages 1204-1209 | Received 26 Jan 2011, Accepted 25 Mar 2011, Published online: 21 Oct 2011

Figures & data

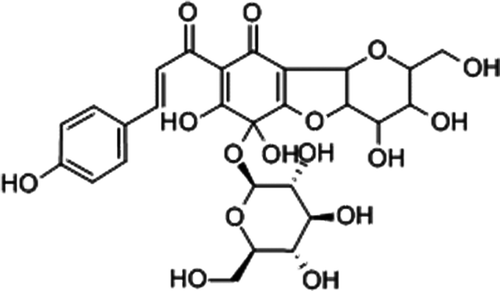
Figure 1.  Structure of carthamin yellow (A)

Figure 1.  Structure of carthamin yellow (A)

Figure 2.  Effect of CTI on S-T segment deviation (mv) of acute myocardial ischemia (AMI) rats. (A) Representative chants of ECG. Differences in the ECG patterns were observed between the groups at 1 and 48 h after isoproterenol-induced AMI model in rats. As the arrows show, the S-T segment and T wave of rats were elevated significantly and were inhibited by CTI and XD. (a), (b), (c), (d), (e), (f), (g), (h) and (i) correspond to groups: (a) control group; (b) model group at 1 h after AMI model established; (c) model group at 48 h after AMI model established; (d) CTIH group at 1 h after AMI model established; (e) CTIH group at 48 h after AMI model established; (f) CTIL group at 1 h after AMI model established; (g) CTIL group at 48 h after AMI model established; (h) XD group at 1 h after AMI model established; (i) XD group at 48 h after AMI model established. The paper speed was 100 mm/s. (B) Effect of CTI on S-T segment deviation (mv) of acute myocardial ischemia (AMI) rats. Results are mean ± SD (n = 10). Compared with sham: *p < 0.05. Compared with AMI: #p < 0.05.
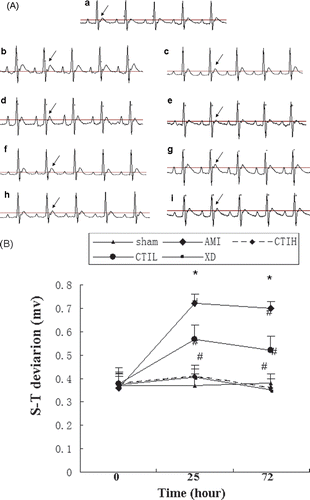
Figure 2.  Effect of CTI on S-T segment deviation (mv) of acute myocardial ischemia (AMI) rats. (A) Representative chants of ECG. Differences in the ECG patterns were observed between the groups at 1 and 48 h after isoproterenol-induced AMI model in rats. As the arrows show, the S-T segment and T wave of rats were elevated significantly and were inhibited by CTI and XD. (a), (b), (c), (d), (e), (f), (g), (h) and (i) correspond to groups: (a) control group; (b) model group at 1 h after AMI model established; (c) model group at 48 h after AMI model established; (d) CTIH group at 1 h after AMI model established; (e) CTIH group at 48 h after AMI model established; (f) CTIL group at 1 h after AMI model established; (g) CTIL group at 48 h after AMI model established; (h) XD group at 1 h after AMI model established; (i) XD group at 48 h after AMI model established. The paper speed was 100 mm/s. (B) Effect of CTI on S-T segment deviation (mv) of acute myocardial ischemia (AMI) rats. Results are mean ± SD (n = 10). Compared with sham: *p < 0.05. Compared with AMI: #p < 0.05.

Figure 3.  Effect of CTI on serum cytokines. Serum TNF-α (A) and IL-6 (B) concentrations in 5 groups examined by radioimmunological assay and liquid phase competitive radioassay. Results are mean ± SD (n = 8). Compared with sham: *p < 0.05. Compared with AMI: #p < 0.05.
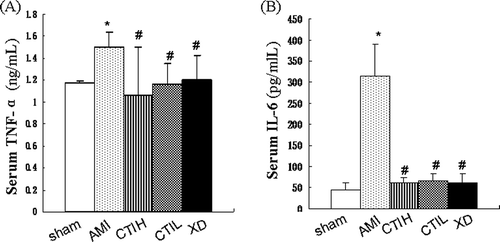
Figure 3.  Effect of CTI on serum cytokines. Serum TNF-α (A) and IL-6 (B) concentrations in 5 groups examined by radioimmunological assay and liquid phase competitive radioassay. Results are mean ± SD (n = 8). Compared with sham: *p < 0.05. Compared with AMI: #p < 0.05.

Figure 4.  Representative HE staining of the myocardium in rats (×400). (a), (b), (c), (d), and (e) correspond to groups: (a) control group showing normal cardiac fiber without inflammatory cells; (b) AMI group showing multiple focal necroses with infiltration of inflammatory cells; (c-e) AMI rats treated with CTI (0.625 and 2.5 g/kg) and XD (20 g/kg).
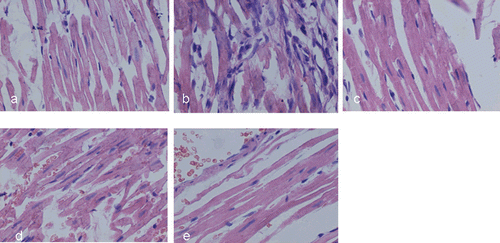
Figure 4.  Representative HE staining of the myocardium in rats (×400). (a), (b), (c), (d), and (e) correspond to groups: (a) control group showing normal cardiac fiber without inflammatory cells; (b) AMI group showing multiple focal necroses with infiltration of inflammatory cells; (c-e) AMI rats treated with CTI (0.625 and 2.5 g/kg) and XD (20 g/kg).

Figure 5.  Expression of Bax and Bcl-2 proteins in myocardium. (A) Representative immunostaining for Bax and Bcl-2 proteins in myocardium in rats (×400). (a), (b), (c), (d), (e), (f), (g), (h), (i), and (j) correspond to groups: (a) control group for Bax; (b) AMI group for Bax; (c) CTIH group for Bax; (d) CTIL group for Bax; (e) XD group for Bax; (f) normal group for Bcl-2; (g) AMI group for Bcl-2; (h) CTIH group for Bcl-2; (i) CTIL group for Bcl-2; (j) XD group for Bcl-2; (B) Semi-quantitative analysis of the optical density of Bax; (C) Semi-quantitative analysis of the optical density of Bcl-2; (D) The calculated Bax/Bcl-2 ratio. Values are shown as mean ± SD (n = 8). Compared with sham: *p < 0.05. Compared with AMI: #p < 0.05.
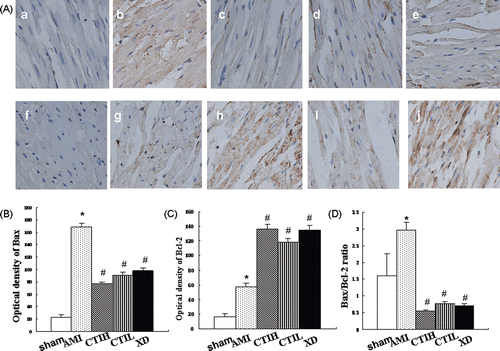
Figure 5.  Expression of Bax and Bcl-2 proteins in myocardium. (A) Representative immunostaining for Bax and Bcl-2 proteins in myocardium in rats (×400). (a), (b), (c), (d), (e), (f), (g), (h), (i), and (j) correspond to groups: (a) control group for Bax; (b) AMI group for Bax; (c) CTIH group for Bax; (d) CTIL group for Bax; (e) XD group for Bax; (f) normal group for Bcl-2; (g) AMI group for Bcl-2; (h) CTIH group for Bcl-2; (i) CTIL group for Bcl-2; (j) XD group for Bcl-2; (B) Semi-quantitative analysis of the optical density of Bax; (C) Semi-quantitative analysis of the optical density of Bcl-2; (D) The calculated Bax/Bcl-2 ratio. Values are shown as mean ± SD (n = 8). Compared with sham: *p < 0.05. Compared with AMI: #p < 0.05.
Reprints and Corporate Permissions

Please note: Selecting permissions does not provide access to the full text of the article, please see our help page How do I view content?

To request a reprint or corporate permissions for this article, please click on the relevant link below:

Academic Permissions

Please note: Selecting permissions does not provide access to the full text of the article, please see our help page How do I view content?

Obtain permissions instantly via Rightslink by clicking on the button below:

If you are unable to obtain permissions via Rightslink, please complete and submit this Permissions form. For more information, please visit our Permissions help page.