770
Views
9
CrossRef citations to date
0
Altmetric
Original Article

Tournefortia sarmentosa extract attenuates acetaminophen-induced hepatotoxicity

, , , , &
Pages 291-396 | Received 23 Mar 2011, Accepted 30 Jun 2011, Published online: 15 Nov 2011

Figures & data

Table 1.  Effect of T. sarmentosa extract on liver function and inflammatory markers in APAP-administrated rats.

Table 2.  Effect of T. sarmentosa extract on liver antioxidant enzyme activities and lipid peroxidation levels in APAP-administrated rats.

Figure 1.  (A) Dose-dependent effect of acetaminophen (APAP) on clone-9 hepatocyte viability. Results have been given as percentage over control (CL). Cells were kept as CL or treated with different concentrations (0−20 mM) of APAP for 24 h. The cell viability was detected by MTT assay. Each bar represents the mean ± standard error of the mean (SEM) from six independent experiments. *p < 0.05 versus CL. (B) Dose-dependent effect of the aqueous extract of T. sarmentosa against APAP-induced toxic effect on cell viability. Cells were kept as CL or stimulated with 10 mM APAP for 24 h. Before stimulated with APAP, clone-9 cells were pretreated with 0−100 μg/mL aqueous extract of T. sarmentosa for 1 h. The cell viability was detected by MTT assay. Each bar represents the mean ± SEM from six independent experiments. *p < 0.05 versus CL. #p < 0.05 versus APAP-treated cells.

Figure 1.  (A) Dose-dependent effect of acetaminophen (APAP) on clone-9 hepatocyte viability. Results have been given as percentage over control (CL). Cells were kept as CL or treated with different concentrations (0−20 mM) of APAP for 24 h. The cell viability was detected by MTT assay. Each bar represents the mean ± standard error of the mean (SEM) from six independent experiments. *p < 0.05 versus CL. (B) Dose-dependent effect of the aqueous extract of T. sarmentosa against APAP-induced toxic effect on cell viability. Cells were kept as CL or stimulated with 10 mM APAP for 24 h. Before stimulated with APAP, clone-9 cells were pretreated with 0−100 μg/mL aqueous extract of T. sarmentosa for 1 h. The cell viability was detected by MTT assay. Each bar represents the mean ± SEM from six independent experiments. *p < 0.05 versus CL. #p < 0.05 versus APAP-treated cells.

Figure 2.  Effect of T. sarmentosa on malondialdehyde (MDA) level in clone-9 cells treated with acetaminophen (APAP). Results have been given as percentage over control (CL). Cells were kept as CL or treated with 10 mM APAP. Before stimulation with acetaminophen (APAP), clone-9 cells were pretreated with 0−100 μg/mL aqueous extract of T. sarmentosa for 1 h. Each bar represents the mean ± standard error of the mean (SEM) from six independent experiments. *p < 0.05 versus CL. #p < 0.05 versus APAP-treated cells.
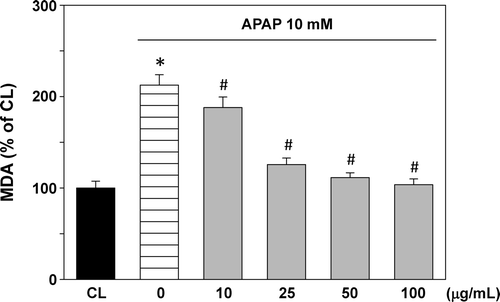
Figure 2.  Effect of T. sarmentosa on malondialdehyde (MDA) level in clone-9 cells treated with acetaminophen (APAP). Results have been given as percentage over control (CL). Cells were kept as CL or treated with 10 mM APAP. Before stimulation with acetaminophen (APAP), clone-9 cells were pretreated with 0−100 μg/mL aqueous extract of T. sarmentosa for 1 h. Each bar represents the mean ± standard error of the mean (SEM) from six independent experiments. *p < 0.05 versus CL. #p < 0.05 versus APAP-treated cells.
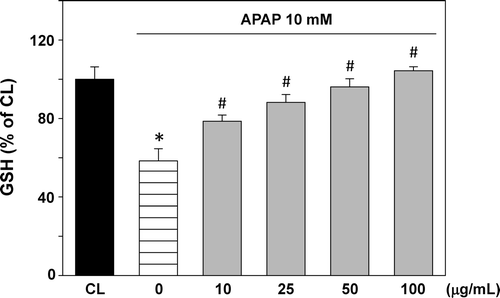
Figure 3.  Effect of T. sarmentosa on glutathione (GSH) level in clone-9 cells treated with acetaminophen (APAP). Results have been given as percentage over control (CL). Cells were kept as CL or treated with 10 mM APAP. Before stimulation with APAP, clone-9 cells were pretreated with 0−100 μg/mL aqueous extract of T. sarmentosa for 1 h. Each bar represents the mean ± standard error of the mean (SEM) from six independent experiments. *p < 0.05 versus CL. #p < 0.05 versus APAP-treated cells.
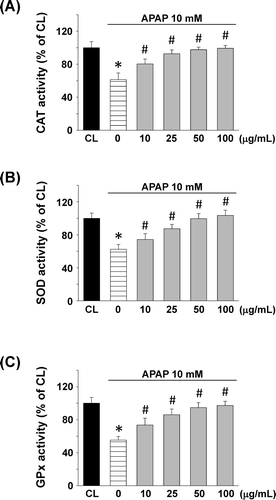
Figure 3.  Effect of T. sarmentosa on glutathione (GSH) level in clone-9 cells treated with acetaminophen (APAP). Results have been given as percentage over control (CL). Cells were kept as CL or treated with 10 mM APAP. Before stimulation with APAP, clone-9 cells were pretreated with 0−100 μg/mL aqueous extract of T. sarmentosa for 1 h. Each bar represents the mean ± standard error of the mean (SEM) from six independent experiments. *p < 0.05 versus CL. #p < 0.05 versus APAP-treated cells.

Figure 4.  Effect of T. sarmentosa on (A) catalase (CAT), (B) superoxide dismutase (SOD), and (C) glutathione peroxidase (GPx) activity in clone-9 cells treated with acetaminophen (APAP). Results have been given as percentage over control (CL). Cells were kept as CL or treated with 10 mM APAP. Before stimulated with APAP, clone-9 cells were pretreated with 0−100 μg/mL aqueous extract of T. sarmentosa for 1 h. Each bar represents the mean ± standard error of the mean (SEM) from six independent experiments. *p < 0.05 versus CL. #p < 0.05 versus APAP-treated cells.

Figure 4.  Effect of T. sarmentosa on (A) catalase (CAT), (B) superoxide dismutase (SOD), and (C) glutathione peroxidase (GPx) activity in clone-9 cells treated with acetaminophen (APAP). Results have been given as percentage over control (CL). Cells were kept as CL or treated with 10 mM APAP. Before stimulated with APAP, clone-9 cells were pretreated with 0−100 μg/mL aqueous extract of T. sarmentosa for 1 h. Each bar represents the mean ± standard error of the mean (SEM) from six independent experiments. *p < 0.05 versus CL. #p < 0.05 versus APAP-treated cells.

Reprints and Corporate Permissions

Please note: Selecting permissions does not provide access to the full text of the article, please see our help page How do I view content?

To request a reprint or corporate permissions for this article, please click on the relevant link below:

Academic Permissions

Please note: Selecting permissions does not provide access to the full text of the article, please see our help page How do I view content?

Obtain permissions instantly via Rightslink by clicking on the button below:

If you are unable to obtain permissions via Rightslink, please complete and submit this Permissions form. For more information, please visit our Permissions help page.