Figures & data
Figure 1. Renin inhibitory phenomena of baicalin (0.1 mg/mL) observed by fluorescence spectrometry assay.
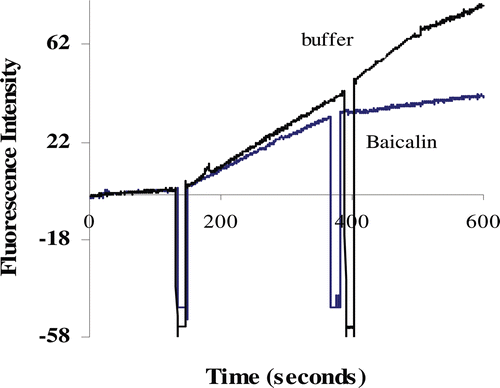
Figure 2. Plot of percentage inhibition of renin activity versus concentration of baicalin. The IC50 for baicalin is 120.36 µM.
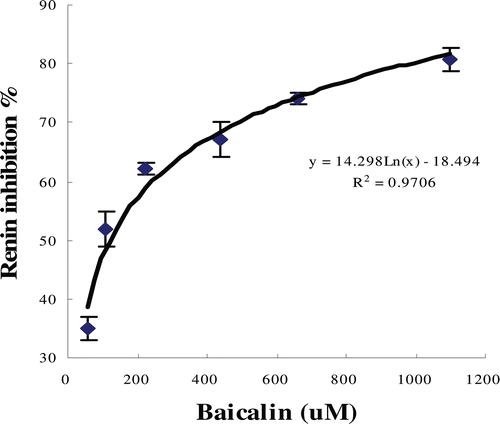
Figure 3. Fluorescence emission spectra of renin (appoximately 40 μg/mL) excited at 280 nm showing the quench effect of increasing concentration of baicalin (0, 1.57, 3.08, 4.53, 5.93, 7.27, 8.87 μΜ).
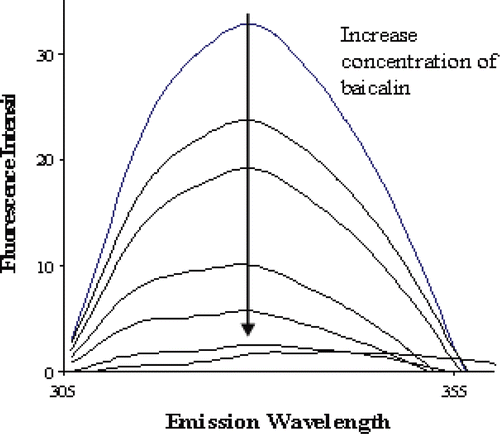
Figure 4. Fluorescence emission spectra of angiotensin-I-converting enzyme excited at 295 nm showing the quench effect of baicalin alone (A) and baicalin in the presence of angiotensin I (B).
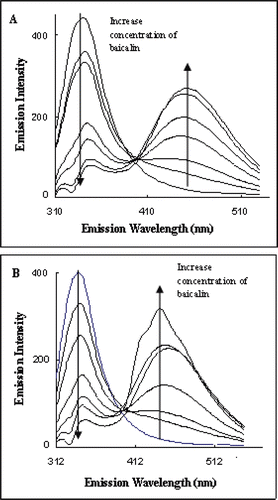
Table 1. Stern−Volmer constant and coefficient for the interaction of baicalin with renin and angiotensin-I converting enzyme (ACE).
Table 2. The binding constants, number of binding sites of complex, and Gibbs free energy for the interaction of baicalin with renin and angiotensin-I-converting enzyme (ACE).