1,520
Views
28
CrossRef citations to date
0
Altmetric
Research Article

Comparative study of the anti-inflammatory and antinociceptive effects of two varieties of Punica granatum

, , , , , , & show all
Pages 429-438 | Received 31 Mar 2011, Accepted 03 Aug 2011, Published online: 01 Feb 2012

Figures & data

Table 1.  Lists of chemical compound found in MoEA and MoES by the phytochemical analysis.

Table 2.  The antinociceptive effect (i.p.) of P.granatum extracts and acetylsalicylic acid on acid acetic-induced visceral pain in mice.

Table 3.  The antinociceptive effect of P.granatum extracts, morphine, acetylsalicylic acid and reversal effect of naloxone on formalin-induced pain in mice.

Figure 1.  Effect of P.granatum extracts (10, 25 and 50 µg/3 µl/rat, i.c.v.), morphine (5 mg/kg, s.c.) and reversal effect of naloxone (1 mg/kg, s.c.) on tail-immersion test, as revealed by change of the estimated areas under the curves (AUC). Values are represented as the mean ± SEM (n = 6). Differences between groups were statistically analyzed by ANOVA followed by Tukey’s multiple range test. bp < 0.01, cp < 0.001 vs. control (saline). ***p < 0.001 vs. the group receiving the same dose of MoES. #p < 0.001 vs. the group receiving the appropriated drug at the same dose without naloxone. MoEA: fruit peel methanol extract of the variety A; MoES: fruit peel methanol extract of the variety S; nal: naloxone; MOR 5: morphine (5 mg/kg, s.c.).
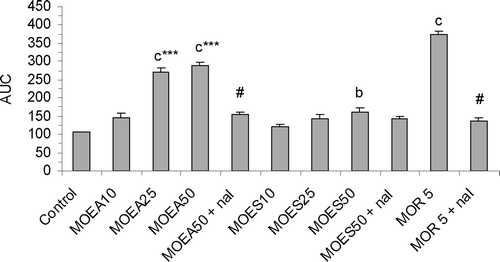
Figure 1.  Effect of P.granatum extracts (10, 25 and 50 µg/3 µl/rat, i.c.v.), morphine (5 mg/kg, s.c.) and reversal effect of naloxone (1 mg/kg, s.c.) on tail-immersion test, as revealed by change of the estimated areas under the curves (AUC). Values are represented as the mean ± SEM (n = 6). Differences between groups were statistically analyzed by ANOVA followed by Tukey’s multiple range test. bp < 0.01, cp < 0.001 vs. control (saline). ***p < 0.001 vs. the group receiving the same dose of MoES. #p < 0.001 vs. the group receiving the appropriated drug at the same dose without naloxone. MoEA: fruit peel methanol extract of the variety A; MoES: fruit peel methanol extract of the variety S; nal: naloxone; MOR 5: morphine (5 mg/kg, s.c.).

Figure 2.  Effect of P.granatum extracts (10, 25 and 50 µg/3 µl/rat, i.c.v.), morphine (5 mg/kg, s.c.) on pain threshold in hotplate test in rats, as revealed by change of the estimated areas under the curves (AUC). Values are represented as the mean ± SEM (n = 6). Differences between groups were statistically analyzed by ANOVA followed by Tukey’s multiple range test. ap < 0.05, bp < 0.01, cp < 0.001 vs. control (saline). MoEA: fruit peel methanol extract of the variety A; MoES: fruit peel methanol extract of the variety S; MOR 5: morphine (5 mg/kg, s.c.).
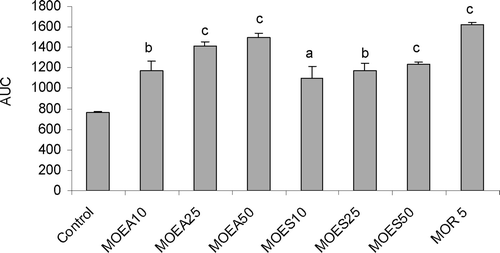
Figure 2.  Effect of P.granatum extracts (10, 25 and 50 µg/3 µl/rat, i.c.v.), morphine (5 mg/kg, s.c.) on pain threshold in hotplate test in rats, as revealed by change of the estimated areas under the curves (AUC). Values are represented as the mean ± SEM (n = 6). Differences between groups were statistically analyzed by ANOVA followed by Tukey’s multiple range test. ap < 0.05, bp < 0.01, cp < 0.001 vs. control (saline). MoEA: fruit peel methanol extract of the variety A; MoES: fruit peel methanol extract of the variety S; MOR 5: morphine (5 mg/kg, s.c.).

Figure 3.  Upper panel: The effect of P.granatum extracts (50, 100 and 150 mg/kg, i.p.) and acetylsalicylic acid (100 mg/kg, i.p.) on induced edema in rats, as revealed by change of the estimated areas under the curves (AUC). Values are represented as the mean ± SEM (n = 6). Differences between groups were statistically analyzed by ANOVA followed Tukey’s multiple range test. ap < 0.05, bp < 0.01, cp < 0.001 vs. control (saline). ***p < 0.001 vs. the group receiving the same dose of MoES. Lower panel: the index of edema inhibition (IEI%) at different time intervals.
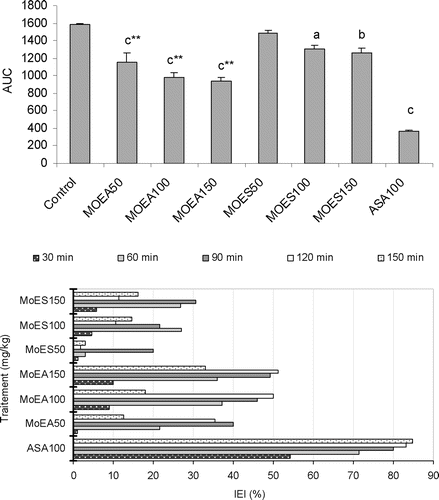
Figure 3.  Upper panel: The effect of P.granatum extracts (50, 100 and 150 mg/kg, i.p.) and acetylsalicylic acid (100 mg/kg, i.p.) on induced edema in rats, as revealed by change of the estimated areas under the curves (AUC). Values are represented as the mean ± SEM (n = 6). Differences between groups were statistically analyzed by ANOVA followed Tukey’s multiple range test. ap < 0.05, bp < 0.01, cp < 0.001 vs. control (saline). ***p < 0.001 vs. the group receiving the same dose of MoES. Lower panel: the index of edema inhibition (IEI%) at different time intervals.

Reprints and Corporate Permissions

Please note: Selecting permissions does not provide access to the full text of the article, please see our help page How do I view content?

To request a reprint or corporate permissions for this article, please click on the relevant link below:

Academic Permissions

Please note: Selecting permissions does not provide access to the full text of the article, please see our help page How do I view content?

Obtain permissions instantly via Rightslink by clicking on the button below:

If you are unable to obtain permissions via Rightslink, please complete and submit this Permissions form. For more information, please visit our Permissions help page.