Figures & data
Table 1. Metabolite profiles of fractions 1–3 determined by GC-MS and reported as % of TIC (total ion current).
Figure 1. Annexin V-FITC isotonic PI double staining experiments along with flow cytometry analysis on BT20 cells incubated with fractions 1–3. The graphs on the left column represent physical parameters such as cell dimension and granulation. On the right column, each graph consists in four quadrants: lower left (LL) representing live cells; lower right (LR) with cells in early phase of apoptosis; upper right (UR) corresponding to cells in late phase of apoptosis; upper left (UL) which constitutes dead cells.
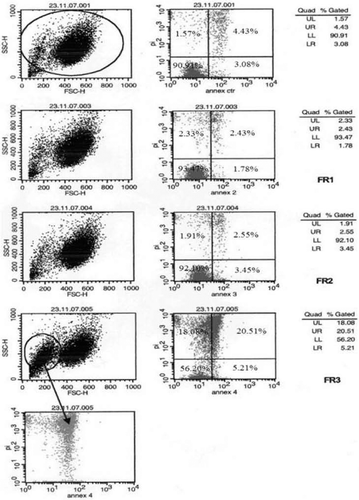
Figure 2. Determination of the cell amounts in each phase of the cell cycle by hypotonic PI staining, followed by cytometry analysis. BT20 cells were incubated with fractions 1–2 (2.5 μg/well) and fraction 3 (4 μg/well) for 48 h. Only fraction 3 provoked 32% of apoptotic cells and arrested the cell cycle at G2/M phase.
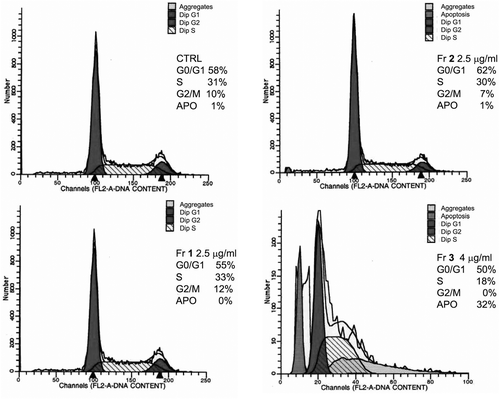
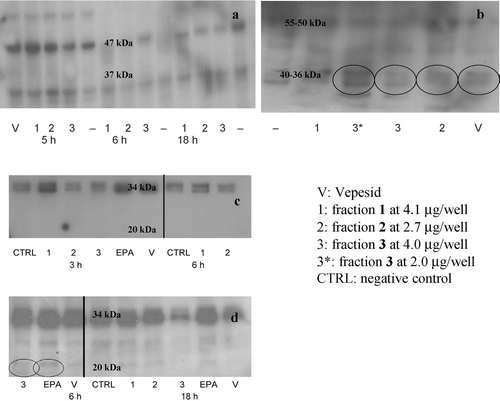
Figure 3. Western blotting experiments. (a): Caspase-9 analysis (47 kDa: uncleaved caspase-9; 37 kDa: active form) upon 5, 6 and 18 h of incubation. (b): Caspase-8 analysis (55–50 kDa: uncleaved caspase-8; 40–36 kDa: active caspase-8). Time of incubation: 5 h. (c-d): Caspase-3 analysis (34 kDa: uncleaved caspase-3; 20 kDa: active caspase-3). Times of incubation: 3, 6 and 18 h. Active caspase-8 was found mainly in BT20 cells incubated with fraction 3 at 2 and 4 μg/well, and in a smaller amount also in those with fraction-2 and Vepesid. Active caspase-3 was found in BT20 cells treated with fraction 3 and EPA after 6 h incubation.