1,060
Views
15
CrossRef citations to date
0
Altmetric
Research Article

In vitro and ex vivo anticholinesterase activities of Erythrina velutina leaf extracts

, , , &
Pages 919-924 | Received 05 Jul 2011, Accepted 10 Dec 2011, Published online: 06 Apr 2012

Figures & data

Figure 1.  In vitro anticholinesterase activity (CA) of aqueous extract (AE) (A), alkaloid-rich extract (AKE) (B), and neostigmine bromide (C) in the mouse cortex. Concentration-response curves were performed for AE (0–1.6 mg/mL), AKE (0–1.6 mg/mL), and the positive control neostigmine (10 nM–10 µM). Enzyme activity was measured using Ellman’s method with slight modifications. Mouse brain homogenates were used as the source of cholinesterase. Data are expressed as the percent CA vs. the log inhibitor concentration (mg/mL) and represent the means ± SEM of four independent experiments performed in duplicate. Graphs are plotted as the cholinesterase activity (CA, %), although the data in the results section are expressed as the cholinesterase inhibition (CI). The CI was calculated as 100% − CA%.
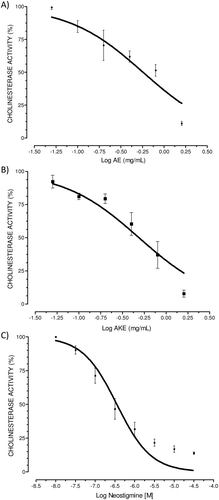
Figure 1.  In vitro anticholinesterase activity (CA) of aqueous extract (AE) (A), alkaloid-rich extract (AKE) (B), and neostigmine bromide (C) in the mouse cortex. Concentration-response curves were performed for AE (0–1.6 mg/mL), AKE (0–1.6 mg/mL), and the positive control neostigmine (10 nM–10 µM). Enzyme activity was measured using Ellman’s method with slight modifications. Mouse brain homogenates were used as the source of cholinesterase. Data are expressed as the percent CA vs. the log inhibitor concentration (mg/mL) and represent the means ± SEM of four independent experiments performed in duplicate. Graphs are plotted as the cholinesterase activity (CA, %), although the data in the results section are expressed as the cholinesterase inhibition (CI). The CI was calculated as 100% − CA%.

Figure 2.  Ex vivo anticholinesterase activity of AE (A), AKE (B), and neostigmine bromide (C) in the mouse cortex. Mice were orally treated with AE or AKE (100, 200, and 400 mg/kg) or neostigmine as the positive control (0.1, 1.0, and 10.0 mg/kg). Enzyme activity was measured using Ellman’s method with slight modifications. Homogenates of mouse brains from animals that were sacrificed 4 h after each treatment were used as the source of cholinesterase. Data are expressed as the percent CA vs. the dose of the inhibitor (mg/kg) and represent the means ± SEM of four independent experiments performed in duplicate. Graphs are plotted as the cholinesterase activity (CA, %), although the data in the results section are expressed as the CI. The CI was calculated as 100% − CA%. *p < 0.05, **p < 0.01, ***p < 0.001 vs. the vehicle control, ANOVA, and post hoc Bonferroni tests.
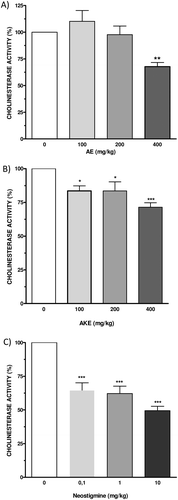
Figure 2.  Ex vivo anticholinesterase activity of AE (A), AKE (B), and neostigmine bromide (C) in the mouse cortex. Mice were orally treated with AE or AKE (100, 200, and 400 mg/kg) or neostigmine as the positive control (0.1, 1.0, and 10.0 mg/kg). Enzyme activity was measured using Ellman’s method with slight modifications. Homogenates of mouse brains from animals that were sacrificed 4 h after each treatment were used as the source of cholinesterase. Data are expressed as the percent CA vs. the dose of the inhibitor (mg/kg) and represent the means ± SEM of four independent experiments performed in duplicate. Graphs are plotted as the cholinesterase activity (CA, %), although the data in the results section are expressed as the CI. The CI was calculated as 100% − CA%. *p < 0.05, **p < 0.01, ***p < 0.001 vs. the vehicle control, ANOVA, and post hoc Bonferroni tests.

Figure 3.  Inhibitory effects of AE or AKE (A), and neostigmine bromide (B) on electric eel acetylcholinesterase activity and horse serum butyrylcholinesterase activity. Enzyme activity was measured using Ellman’s method with slight modifications. Data are expressed as the percent CA vs. the log of the inhibitor concentration (mg/mL or M) and represent the means ± SEM of two independent experiments performed in triplicate. Graphs are plotted as the cholinesterase activity (CA, %), although the data in the results section are expressed as the CI. The CI was calculated as 100% − CA%.
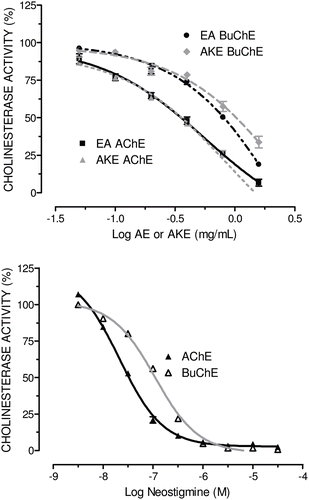
Figure 3.  Inhibitory effects of AE or AKE (A), and neostigmine bromide (B) on electric eel acetylcholinesterase activity and horse serum butyrylcholinesterase activity. Enzyme activity was measured using Ellman’s method with slight modifications. Data are expressed as the percent CA vs. the log of the inhibitor concentration (mg/mL or M) and represent the means ± SEM of two independent experiments performed in triplicate. Graphs are plotted as the cholinesterase activity (CA, %), although the data in the results section are expressed as the CI. The CI was calculated as 100% − CA%.

Reprints and Corporate Permissions

Please note: Selecting permissions does not provide access to the full text of the article, please see our help page How do I view content?

To request a reprint or corporate permissions for this article, please click on the relevant link below:

Academic Permissions

Please note: Selecting permissions does not provide access to the full text of the article, please see our help page How do I view content?

Obtain permissions instantly via Rightslink by clicking on the button below:

If you are unable to obtain permissions via Rightslink, please complete and submit this Permissions form. For more information, please visit our Permissions help page.