Figures & data
Table 1. Body weight, and mean water uptake during the experiments.
Figure 1 . Quantitative real-time RT-PCR analysis of collagen type I and III (A) and elastin (B) in the aorta from control and treated rats. Values are presented as ratio of mRNA to 18S rRNA. Data are mean ± SEM, n = 10 in each group. *p < 0.05, **p < 0.01 (versus CRTL), τp < 0.05, ττp < 0.01 (versus Gua group), §p < 0.05, §§p < 0.01 (versus Los group). CTRL: control, Gua: sympathectomy group, Los: losartan-treated group, Gua + Los: combined treatment group.
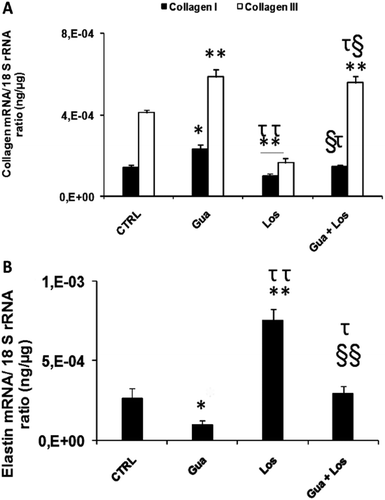
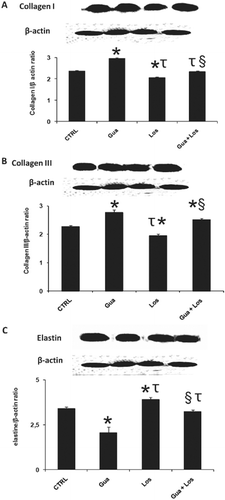
Figure 2 . Immunoblot analysis and densitometric quantification of collagen I (A) and III (B) and elastin (C) in the aorta from control and treated rats. Values are presented here as ratio of collagen I, collagen III or elastin content to β-actin. Data are mean ± SEM; n = 10 in each group. *p < 0.05 (versus CRTL), τp < 0.05 (versus Gua group), §p < 0.05 (versus Los group). CTRL: control group, Gua: sympathectomy group, Los: losartan-treated group, Gua + Los: combined treatment group.